2. Theoretical principles
A digital image is a matrix in which each element called a pixel contains spatial information from the light intensity reflected by the photographed scene. This light intensity can also be resolved spectrally. The spectral resolution of an image can range from a single spectral information (panchromatic/monochromatic image) to more than 1000 spectral channels (hyperspectral image).
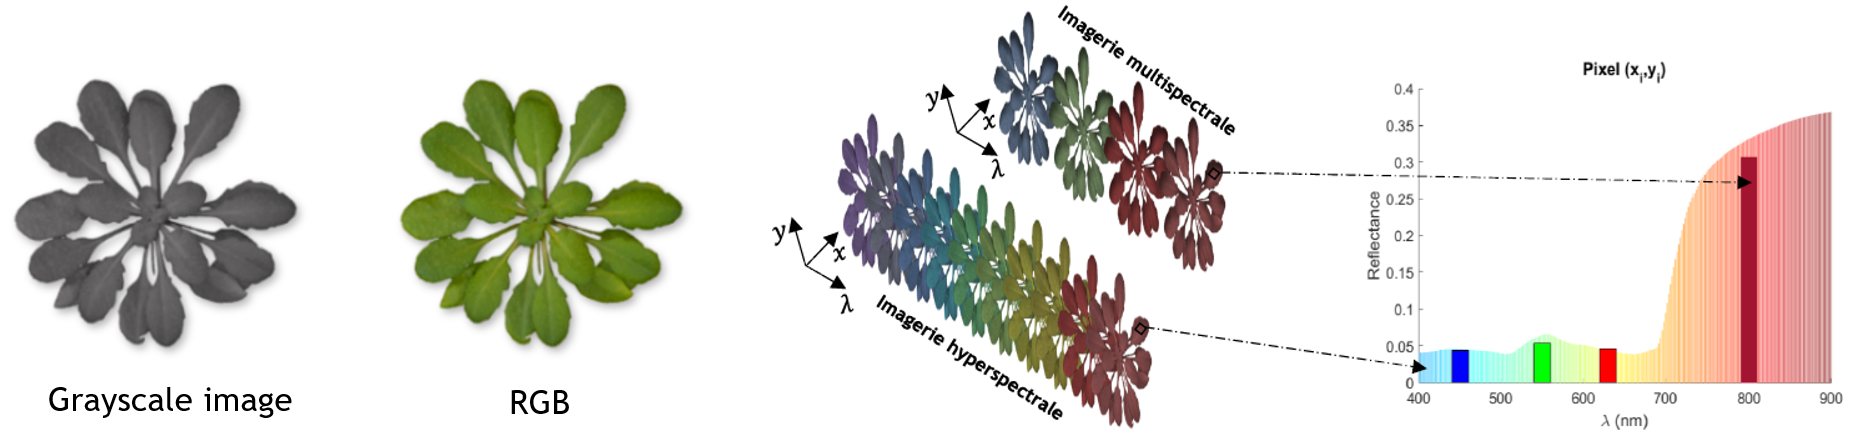
Thus a hyperspectral image is a three-dimensional matrix called datacube or hypercube. Two dimensions are spatial and the third is spectral. Thus each pixel of a hyperspectral image contains a spectrum of the photographed scene:
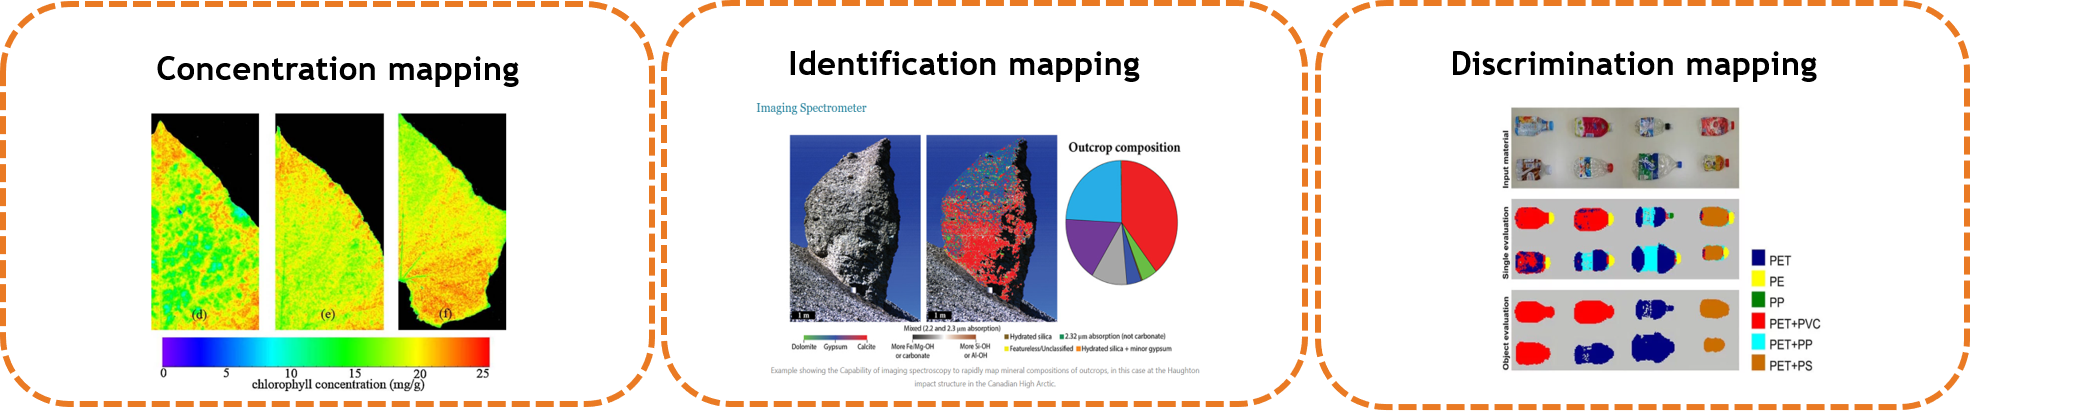
Hyperspectral imaging thus makes it possible to obtain spatial and spectral information about a scene. Its use coupled with spectroscopy analysis tools (chemometrics, index calculation or neural network) allows to estimate maps of concentration, identification or discrimination of chemical compounds from the photographed scene.
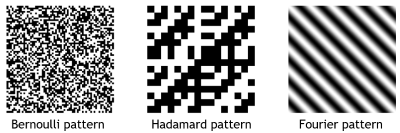
Single pixel imaging enables to reproduce a parsimonious under-sampled image of a scene using a single detector and several acquisitions. For each measurement, a specific pattern is projected onto a scene and an associated spectral coefficient is acquired.
A real positive measurement,
Three examples of patterns from distinct bases are represented below:
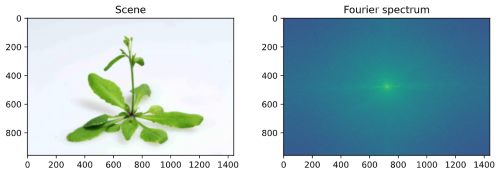
In a coordinate system (𝑥, 𝑦) a scene 𝑆 is analysable in the spatial frequency domain (𝑢, 𝑣) using its two-dimensional Fourier transform
This duality in 2D space is represented below:
Numerically, this relationship can be decomposed into two double sums such that:
This relationship is reflected in the fact that a Fourier spectrum is reconstructable after projections of a series of real patterns (represented by the cosine) and a series of imaginary patterns (represented by the sine)
This double projection is compensated by the conjugate symmetry property of the Fourier transform. It is then only necessary to measure the values of a half spectrum in order to deduce the entirety:
