TensorBoard 2.2.2 #3652
TensorBoard 2.2.2 #3652
Conversation
…3510)

Summary:
We initially used `dataclass_compat` to perform filtering of large
graphs as a stopgap mechanism. This commit moves that filtering into the
uploader, which is the only surface in which it’s actually used. As a
result, `dataclass_compat` no longer takes extra arguments and so can be
moved into `EventFileLoader` in a future change.

Test Plan:
Unit tests added to the uploader for the small graph, large graph, and
corrupt graph cases.

wchargin-branch: uploader-graph-filtering
* Update description and landing page video

Adding Dev Summit 2020 video. Feel free to edit.

* Update _index.yaml

* Update _index.yaml

* Update _index.yaml

* review: fix long line in _index.yaml

Co-authored-by: Nick Felt <nfelt@users.noreply.github.com>
…low#3498)

Note that this is the ng_tensorboard version of tensorflow#3483.

* Motivation for features / changes
Reduce the load on TensorBoard servers by disabling auto reload if the page is not considered visible.

* Technical description of changes
Do not auto reload if document is not visible according to the Page
Visibility API. When page again becomes visible perform an auto reload
if one has been missed.
tensorflow#3506) * Motivation for features / changes * Continue developing DebuggerV2 plugin, specifically the part that focuses on intra-graph execution. * Technical description of changes * debugger_types: add `graphExecutions` field to `DebuggerState` * tfdbg2_data_source.ts: add `fetchGraphExecutionDigests()` and `fetchGraphExecutionData()` * debugger_actions.ts: add action for requesting # of graph executions and action that signifies the successful loading of the # of graph executions * debugger_reducers.ts: add reducers for the said actions and states * views/graph_executions folder: add component and container for visualizing graph executions. Currently only the number of graph executions is shown. Follow-up PRs will add a virtual scroll element that shows the graph execution digests. * Update the CSS and layout in the top-section of DebuggerV2 Plugin to accommodate the new `GraphExecutionContainer`. * Screenshots of UI changes * 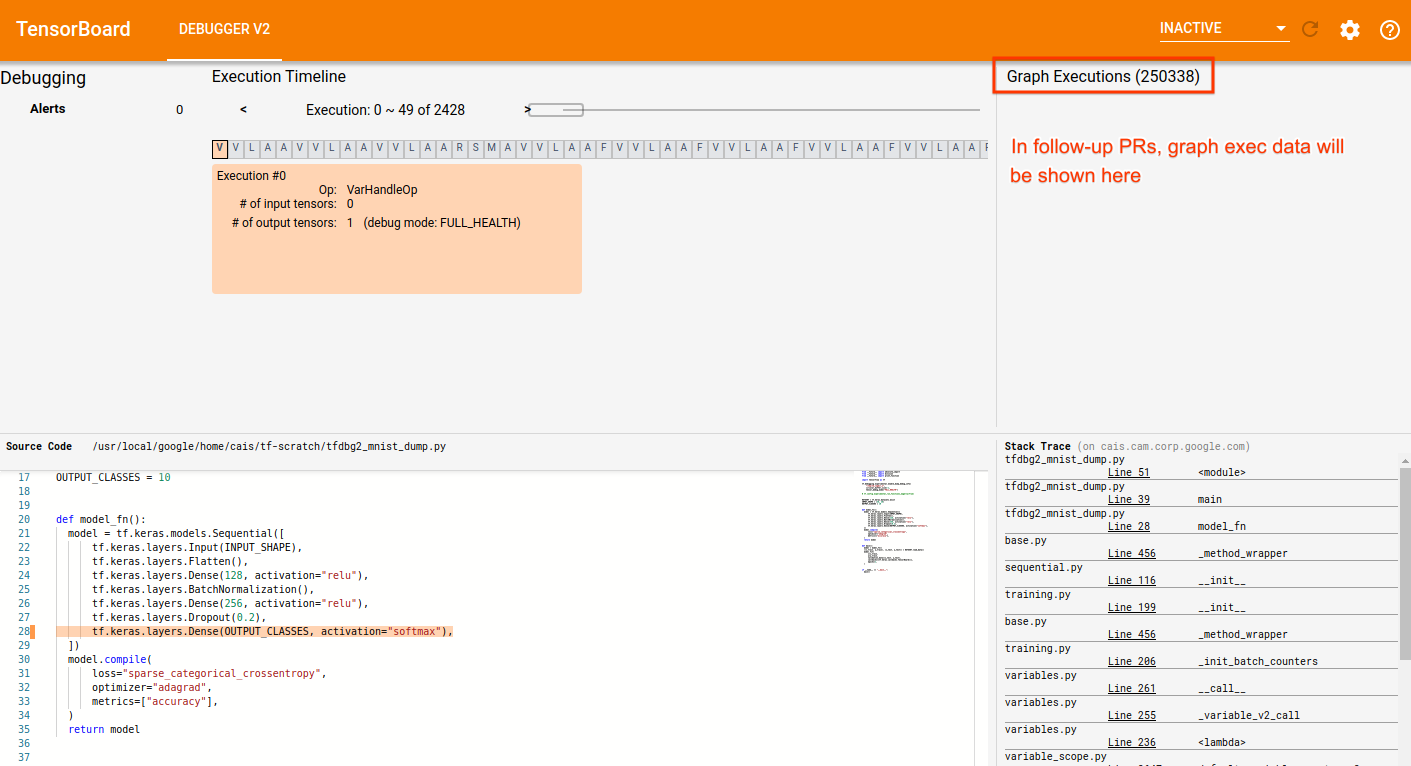 * Detailed steps to verify changes work correctly (as executed by you) * Unit tests added * Running the DebuggerV2 plugin against a logdir with real tfdbg2 dump data
Explain that TensorBoard.dev now supports graphs dashboards.
Provide a link to an experiment with both scalars and graphs.
Summary:
The `data_compat` and `dataclass_compat` transforms are now effected by
the `EventFileLoader` class. The event accumulator and uploader
therefore no longer need to effect these transformations manually.

Test Plan:
Unit tests that use mocking have been updated to apply compat transforms
manually. Using the uploader with `--plugin scalars,graphs` still works
as intended.

wchargin-branch: efl-compat-transforms
Summary:
The `dataclass_compat` transform dispatches on plugin name, which is
stored in the summary metadata. But the semantics of summary metadata is
that it need only be set in the first event of each time series. Thus,
until now, events past the first step of a time series have not been
modified by `dataclass_compat`. This has been fine because all
transformations have been either (a) only metadata transforms (which
don’t matter after the first step anyway) or (b) tensor transforms to
hparams data (which only ever has one step anyway). But an upcoming
change will need to transform every step of each audio time series, so
we need to identify which summaries have audio data even when they don’t
have plugin name set on the same event.

To do so, we let `dataclass_compat` update a stateful map from tag name
to the first `SummaryMetadata` seen for that time series (scoped to a
particular run).

Test Plan:
Some unit tests included now; the tests for migration of audio summaries
will be more complete because they have more interesting things to test.

wchargin-branch: dataclass-compat-initial-metadata
Summary:
Most versions of the audio summary APIs only support writing audio data,
but the TB 1.x `tensorboard.summary.audio` ops also support attaching a
“label” (Markdown text) to each audio clip. This feature is not present
in any version of the TensorFlow summary APIs, including `tf.contrib`,
and is not present in the TB 2.x `tensorboard.summary.audio` API. It
hasn’t been widely adopted, and doesn’t integrate nicely in its current
form with upcoming efforts like migrating the audio dashboard to use the
generic data APIs.

This commit causes labels to no longer be read by TensorBoard. Labels
are still written by the TB 1.x summary ops if specified, but now print
a warning. Because we do not change the write paths, it is important
that `audio.metadata` *not* set `DATA_CLASS_BLOB_SEQUENCE`, because
otherwise audio summaries will not be touched by `dataclass_compat`.
Tests for `dataclass_compat` cover this.

We don’t think that this feature has wide adoption. If this change gets
significant pushback, we can look into restoring labels with a different
implementation, likely as a parallel tensor time series.

Closes tensorflow#3513.

Test Plan:
Unit tests updated. As a manual test, TensorBoard still works on both
legacy audio data and audio data in the new form (that’s not actually
written to disk yet), and simply does not display any labels.

wchargin-branch: audio-no-labels
Summary:
This patch teaches the audio plugin to support generic data providers.

This requires a few more `list_blob_sequences` queries than we’d like,
due to the current structure of the frontend. Some have been avoided by
pushing the content type of the waveform into the query string. A bit of
care is required to ensure that a malicious request cannot turn this
into an XSS hole; we do so by simply whitelisting a (singleton) set of
audio content types, which means that the safety properties are
unchanged by this patch.

Test Plan:
The audio dashboard now works even if the multiplexer is removed. The
audio dashboard doesn’t have any “extras” (data download links, etc.),
so just checking the basic functionality suffices. Unit tests updated.

wchargin-branch: audio-generic
Summary:
This patch adds a decorator and context manager for latency profiling.
Any file can just add `@timing.log_latency` to a function definition or
introduce a `with timing.log_latency("some_name_here"):` context
anywhere. The output structure reveals the nesting of the call graph.

The implementation is thread-safe, and prints the current thread’s name
and ID so that the logs can easily be disentangled. (Basically, just
find a line that you’re interested in, note the thread ID, and pass the
log through `grep THREAD_ID` to get a coherent picture.)

I’ve added this as a global build dep on `//tensorboard` so that it’s
easy to patch timing in for debugging without worrying about build deps.
Any `log_latency` uses that are actually committed should be accompanied
by a strict local dep.

This patch combines previous independent drafts by @nfelt and @wchargin.

Test Plan:
Simple API usage tests included. As a manual test, adding latency
decoration to a few places in the text plugin’s Markdown rendering
pipeline generates output like this:

```
I0417 13:31:01.586319 140068322420480 timing.py:118] Thread-2[7f64329a2700] ENTER markdown_to_safe_html
I0417 13:31:01.586349 140068322420480 timing.py:118] Thread-2[7f64329a2700]   ENTER Markdown.convert
I0417 13:31:01.586455 140068322420480 timing.py:118] Thread-2[7f64329a2700]   LEAVE Markdown.convert - 0.000105s elapsed
I0417 13:31:01.586492 140068322420480 timing.py:118] Thread-2[7f64329a2700]   ENTER bleach.clean
I0417 13:31:01.586783 140068322420480 timing.py:118] Thread-2[7f64329a2700]   LEAVE bleach.clean - 0.000288s elapsed
I0417 13:31:01.586838 140068322420480 timing.py:118] Thread-2[7f64329a2700] LEAVE markdown_to_safe_html - 0.000520s elapsed
```

This is only emitted when `--verbosity 0` is passed, not by default.

Co-authored-by: Nick Felt <nfelt@users.noreply.github.com>
wchargin-branch: timing-log-latency
Summary:
By design, we only expose an API for converting Markdown to *safe* HTML.
But clients who call this method many times end up performing HTML
sanitization many times, which is expensive: about an order of magnitude
more expensive than Markdown conversion itself. This patch introduces a
new API that still only emits safe HTML but enables clients to combine
multiple input documents with only one round of sanitization.

Test Plan:
The `/data/plugin/text/text` route sees 40–60% speedup: on my machine,

  - from 0.38 ± 0.04 seconds to 0.211 ± 0.005 seconds on the “higher
    order tensors” text demo downsampled to 10 steps; and
  - from 5.3 ± 0.9 seconds to 2.1 ± 0.2 seconds on a Google-internal
    dataset with 32 Markdown cells per step downsampled to 100 steps.

wchargin-branch: text-batch-bleach
* Add projector plugin colab

* Adds a colab demo demonstrating how to use the projector plugin locally.

* Add embedding_projector image for colab

* Add colab to _book.yaml

* Add analysis to projector plugin

* Adding images for embedding projector colab

* Rename Projector plugin to Embedding projector
Bazel is now out of the beta mode (version 0.x). We want to depend on
1+ for better long term support in the future.
* Motivation for features / changes * Continue developing DebuggerV2 plugin, specifically its GraphExecutionContainer that visualizes the details of the intra-graph execution events. * Technical description of changes * Add necessary actions, selectors, reducers and effects to support the lazy, paged loading of `GraphExecution`s * Add a `cdk-virtual-scroll-viewport` to `GraphExecutionComponent` * The lazy loading is triggered by scrolling events on the `cdk-virtual-scroll-viewport` * The displaying detailed debug-tensor summaries such as dtype, rank, shape, and numeric breakdown will be added in the follow PRs. This PR just adds displaying of the tensor name and op type in the `cdk-virtual-scroll-viewport`. * Screenshots of UI changes * Loaded state: 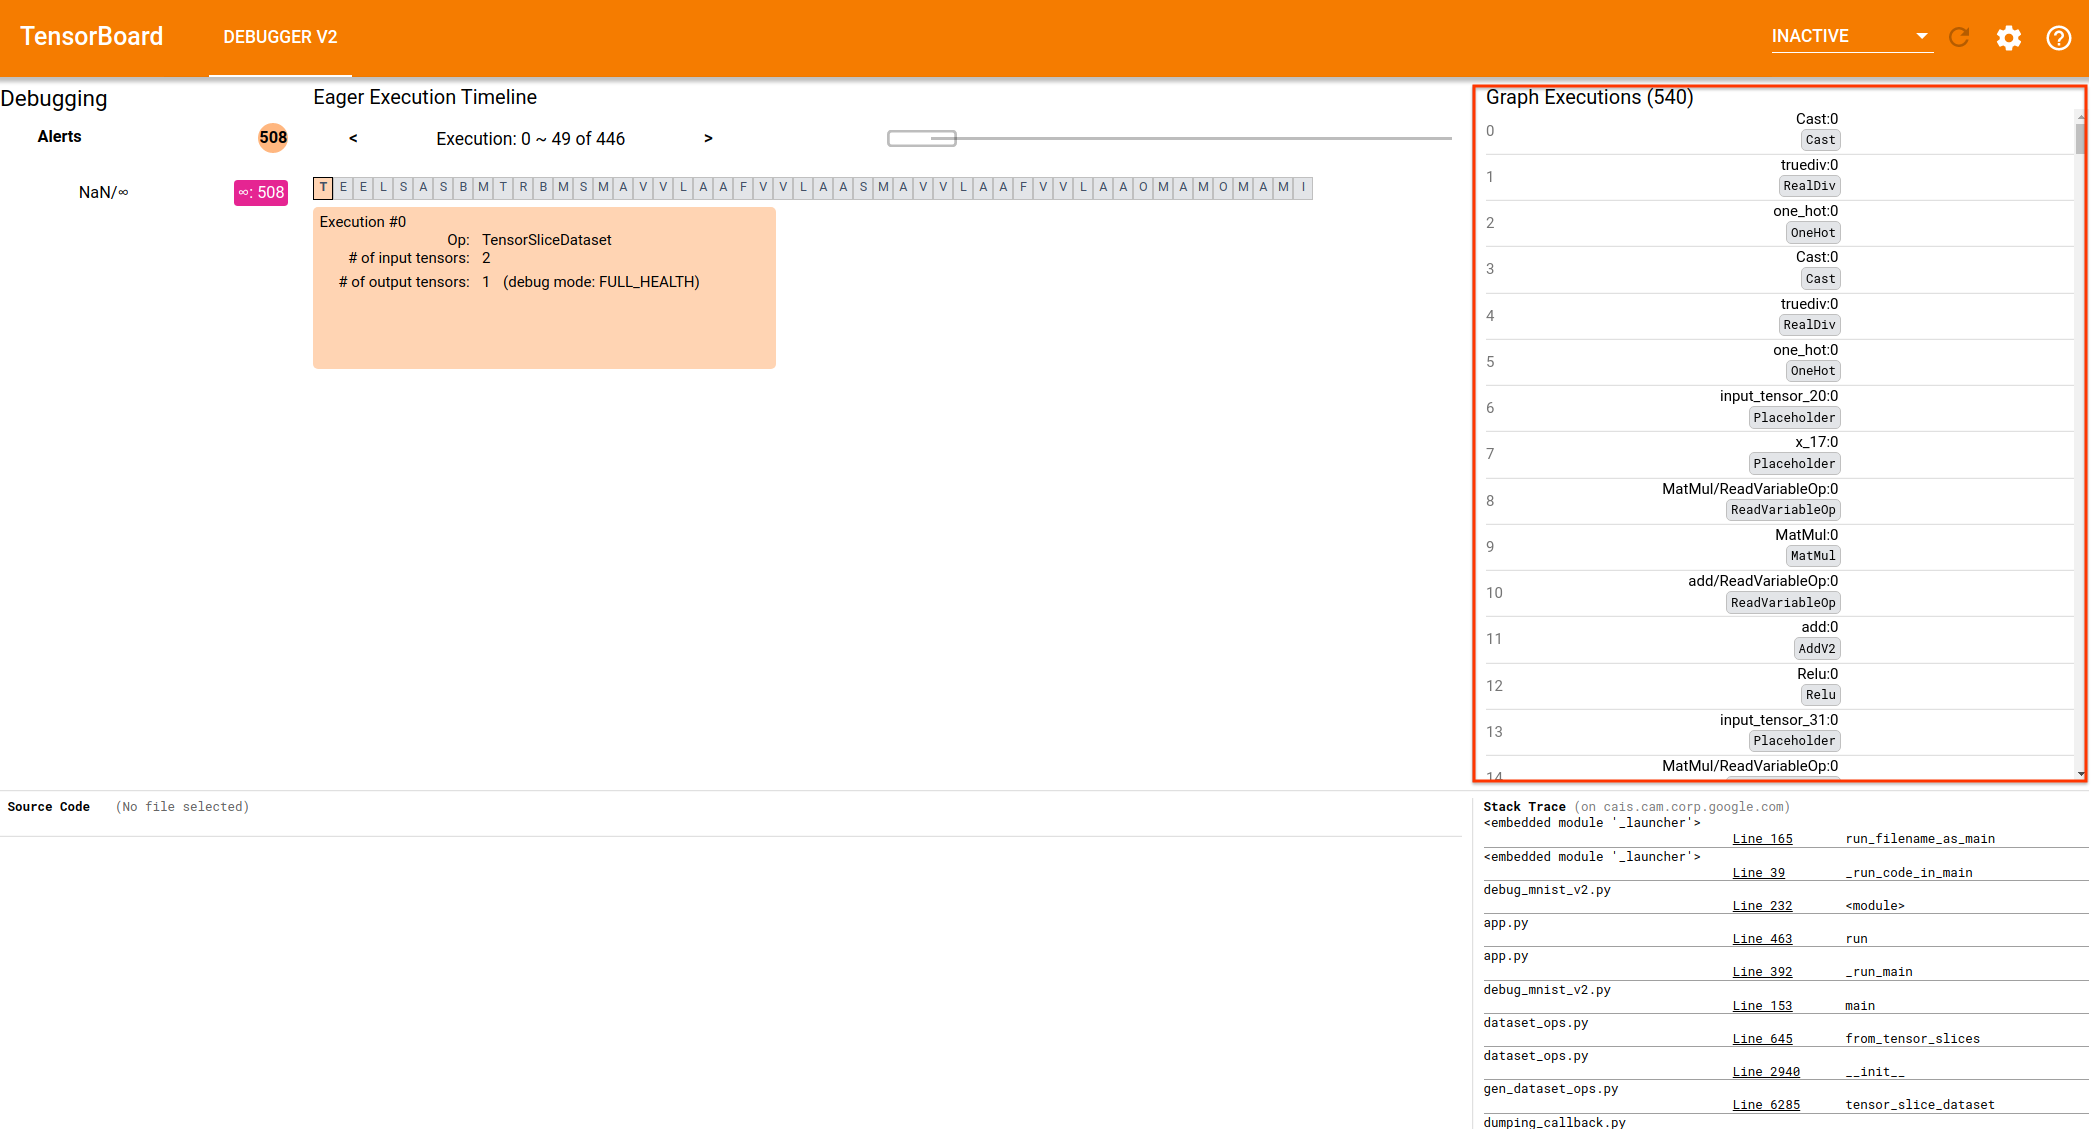 * Loading state (mat-spinner to be added in follow-up CLs): 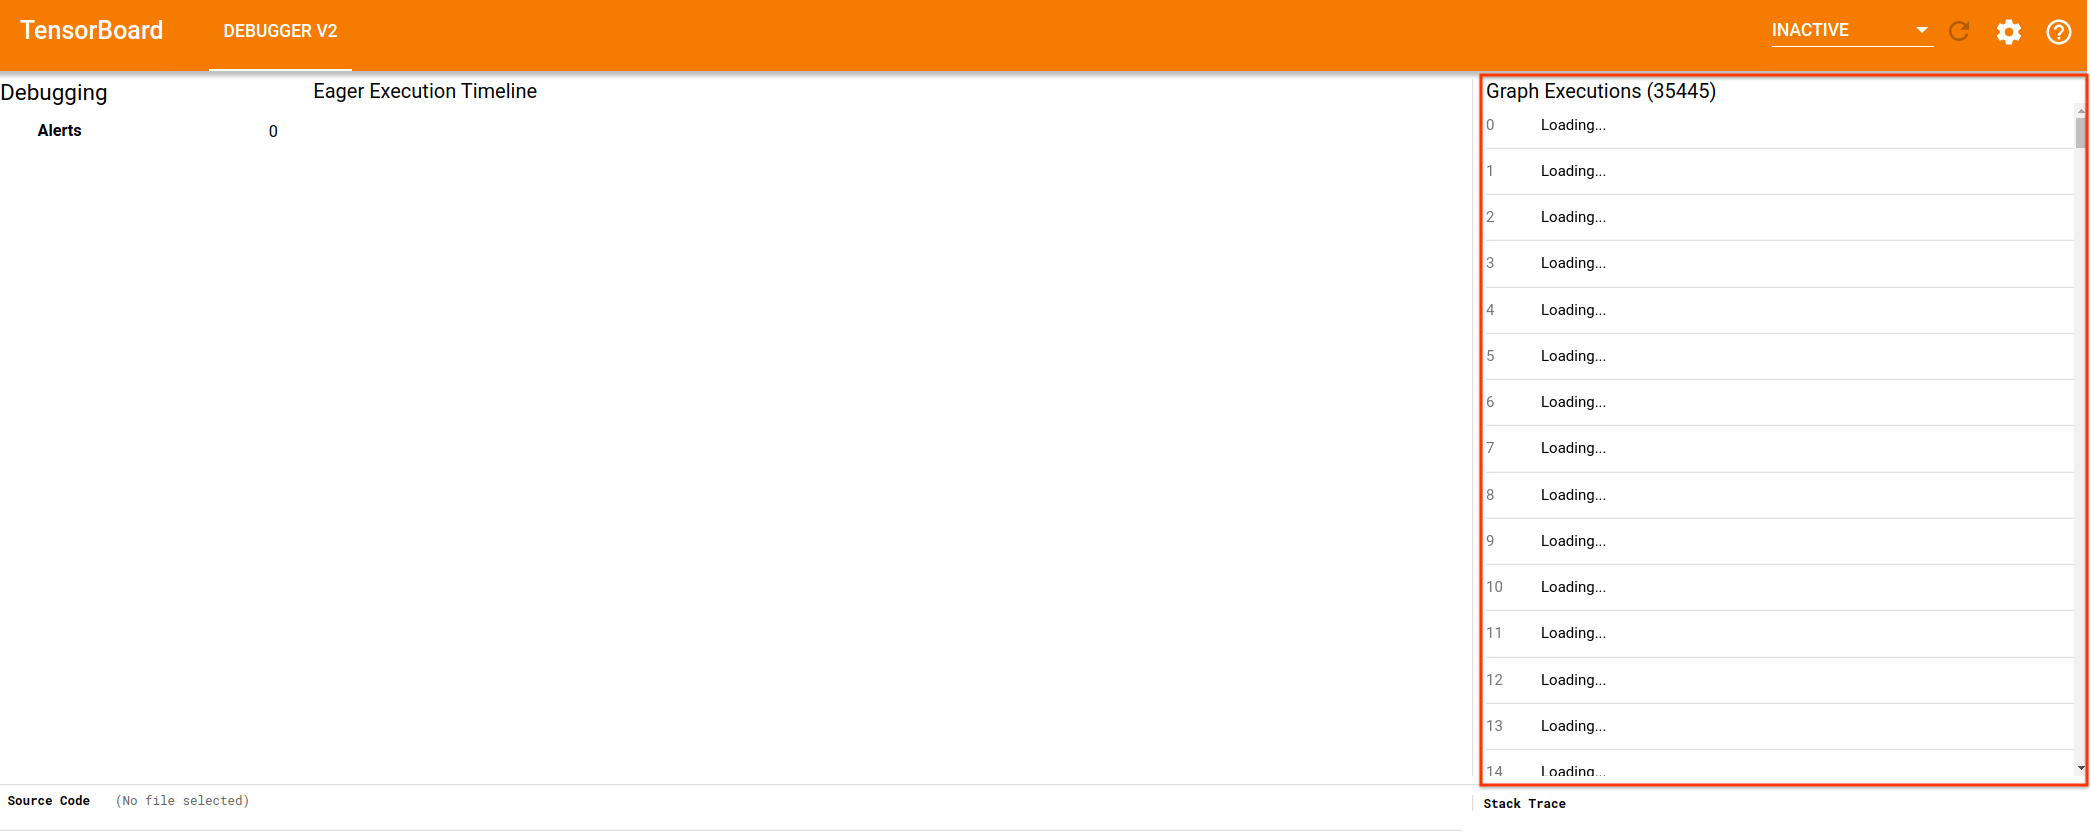 * Detailed steps to verify changes work correctly (as executed by you) * Unit tests added * Manual testing against logdirs with real tfdbg2 data of different sizes
Internal application would like to use the initialState for other
purposes. Expose it as a public API.
* Bump Bazel minimum version to 2.1.0 to match CI

* Remove obsolete .bazelrc settings
Notable changes:

Angular 8 -> Angular 9
zonejs upgrade
ngrx @ 9
TypeScript @ 3.8.3
Karma @ 5
Angular Ivy compiler (ngcc)
Updated rules_nodejs to make it work with Ivy compiler
use node 11 in travis
We used 1 as inspiration to our changes.

Other notable changes:

window.require is frozen object after require.js upgrade
)

Identify tests in uploader_test.py that specifically target logic in _ScalarBatchedRequestSender and rewrite them to only use _ScalarBatchedRequestSender and none of the other layers in uploader.py.

This is a useful exercise for the work on _TensorBatchedRequestSender. I was having a difficult time using _ScalarBatchedRequestSender tests to establish a pattern for testing _TensorBatchedRequestSender.
We identified few several expensive operations going on underneath Plottable.
- When we modified dataset() attached to a plot, Plottable recalculated
  domain which in turn triggered redraw of the plot.
- Plot redraw is scheduled but repeated `clearTimeout` and `setTimeout`
  take considerable time which was the large part of the dataset update
- Changing a dataset caused us to updateSpecialDataset N times (N =
  number of runs)

We addressed the issue by:
- `commit` API after making all the changes
- remember which runs/dataset were changed
- update datasets only once per commit

We did not address:
- autoDomain recomputing the bounds on every data changes.
  - there is no programmatical way to disable auto domain unless we
    change the domain which causes, for instance,  zoom level to reset

Empirically, the render time:
- toggling run on the selector went down from 1740ms to 273ms
- triggering the log scale went down from 315ms to 264ms
  - from ~670ms to ~620ms when measured from mouse up

Do note that this change does not improve time for other charting
operation like zoom, smoothing changes, and etc...
Remove standalone uploader binary target that shouldn't be used any longer.

No longer make //tensorboard/uploader a binary target.
Rename uploader_main to uploader_subcommand.
Clean up some BUILD target names by removing "_lib" suffix.
Summary:
TensorBoard typically reads from a logdir on disk, but the `--db_import`
and `--db` flags offered an experimental SQLite-backed read path. This
DB mode has always been clearly marked as experimental, and does not
work as advertised. For example, runs were broken in all dashboards.
A data set with *n* runs at top level would show as *n* runs in
TensorBoard, but all of them would have the name `.` and the same color,
and only one of them would actually render data. The images dashboard
was also completely broken and did not show images. And lots of plugins
just didn’t support DB mode at all. Furthermore, the existence of DB
mode is an active impediment to maintenance, and also accounts for some
of the few remaining test cases that require TensorFlow 1.x to run.

This patch removes support for DB mode from all plugins, removes the
`db_connection_provider` field from `TBContext`, and renders the `--db`
and `--db_import` flags functionally inoperative. The plumbing itself
will be removed in a separate commit; a modicum of care is required for
the `TensorBoardInfo`  struct.

Test Plan:
Running with a standard demo logdir, TensorBoard still works fine with
both `--generic_data false` and `--generic_data true`.

wchargin-branch: nodb-functionality
The future _TensorBatchedRequestSender behaves similarly to the existing _ScalarBatchedRequestSender. This change refactors some of the less-trivial logic out from _ScalarBatchedRequestSender to be reused in _TensorBatchedRequestSender.

Refactor logic for managing request byte budget into its own class and for pruning empty runs and tags into its own function.

One test is improved to use mocked _ByteBudgetManager.
When tooltipColumns become shorter after a change, we currently do not
remove the DOM. This can lead to an awkward UX where a column in the
tooltip never updates and go stale.

This change removes the tooltip row column DOM when they are no longer
shown.

FYI: the tooltip header was properly removed before.
…ps (tensorflow#3544)

* Motivation for features / changes
  * This is a follow-up / clean-up task for adding Const ops to the set of instrumented ops by tfdbg2 (b/153722488)
* Technical description of changes
  * In debugger_v2_plugin_test.py, several assertions related to the exact set of ops executed inside tf.functions (Graphs) are updated to reflect the Const ops that weren't instrumented previously but are now.
  * Disabling tags for the task are removed from the BUILD file.
…ecution/data routes (tensorflow#3526)

* Motivation for features / changes
  * Fix a performance issue in the HTTP route /graph_execution/data
  * The issue has to do with the fact that `DebugDataMultiplexer.GraphExecutionData()` uses the inefficient approach of reading all the `GraphExecutionTrace`s first and then slice the array. A much more efficient approach (analogous to the `DebugDataMultiplexer.ExecutionData()` for top-level executions) is to use the range reading support of `DebugDatataReader.graph_execution_traces()` that is now available.
  * Similarly, use the range reading support of `DebugDatataReader.execution()` in the `/execution/data` route.
* Technical description of changes
  * See the description above. Use range reading support of `DebugDatataReader.execution()` and `DebugDatataReader.graph_execution_trace()`.
  * Also, remove an extraneous element in the json response (`num_digests`). It is not in the design spec and was included due to oversight on my part.
* Detailed steps to verify changes work correctly (as executed by you)
  * No new unit tests are required to verify the correctness of the new implementation. The existing ones suffice.
  * Manual testing in the web GUI to confirm much more efficient loading.
…-execution components (tensorflow#3541) * Motivation for features / changes * Let the relatively new `GraphExecutionComponent` display details information about debugger-instrumented tensors, such as dtype, rank, size, shape, breakdown of numerical values by type (inf, nan, zero, etc.), and whether inf/nan exists. * In the older `ExecutionDataComponent` for eager tensors, replace the old Angular code that serves a similar purpose with the same Component as used by `GraphExecutionComponent`. This improves unity and reduces maintenance overhead going forward. * Technical description of changes * Add type `DebugTensorValue` to store/debugger_types.ts. The new interface defines the possible types of data available from various `TensorDebugMode`s (an existing enum). * Add helper function `parseDebugTensorValue()` in a new file store/debug_tensor_value.ts to parse an array representation of TensorDebugMode-specific debugger-generated tensor data into a `DebugTensorValue`. * Add `DebugTensorValueComponent` and its various subcomponents in new folder views/debug-_tensor_value/ * Use `DebugTensorValueComponent` from `GraphExecutionComponent` and `ExecutionDataComponent`. * Screenshots of UI changes * CURT_HEALTH mode: 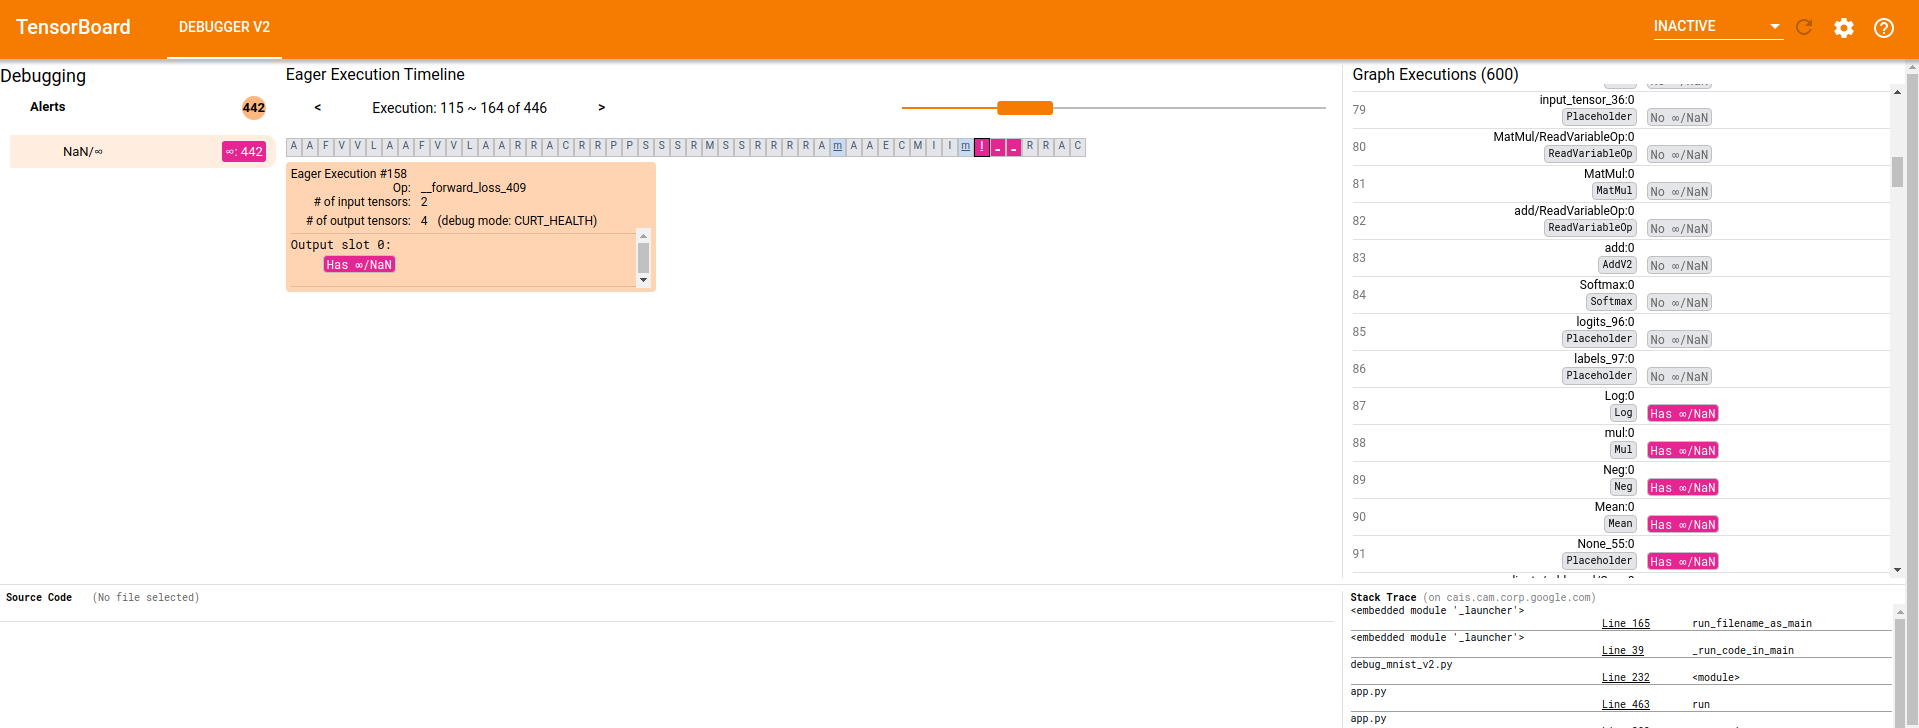 * CONCISE_HEALTH mode: 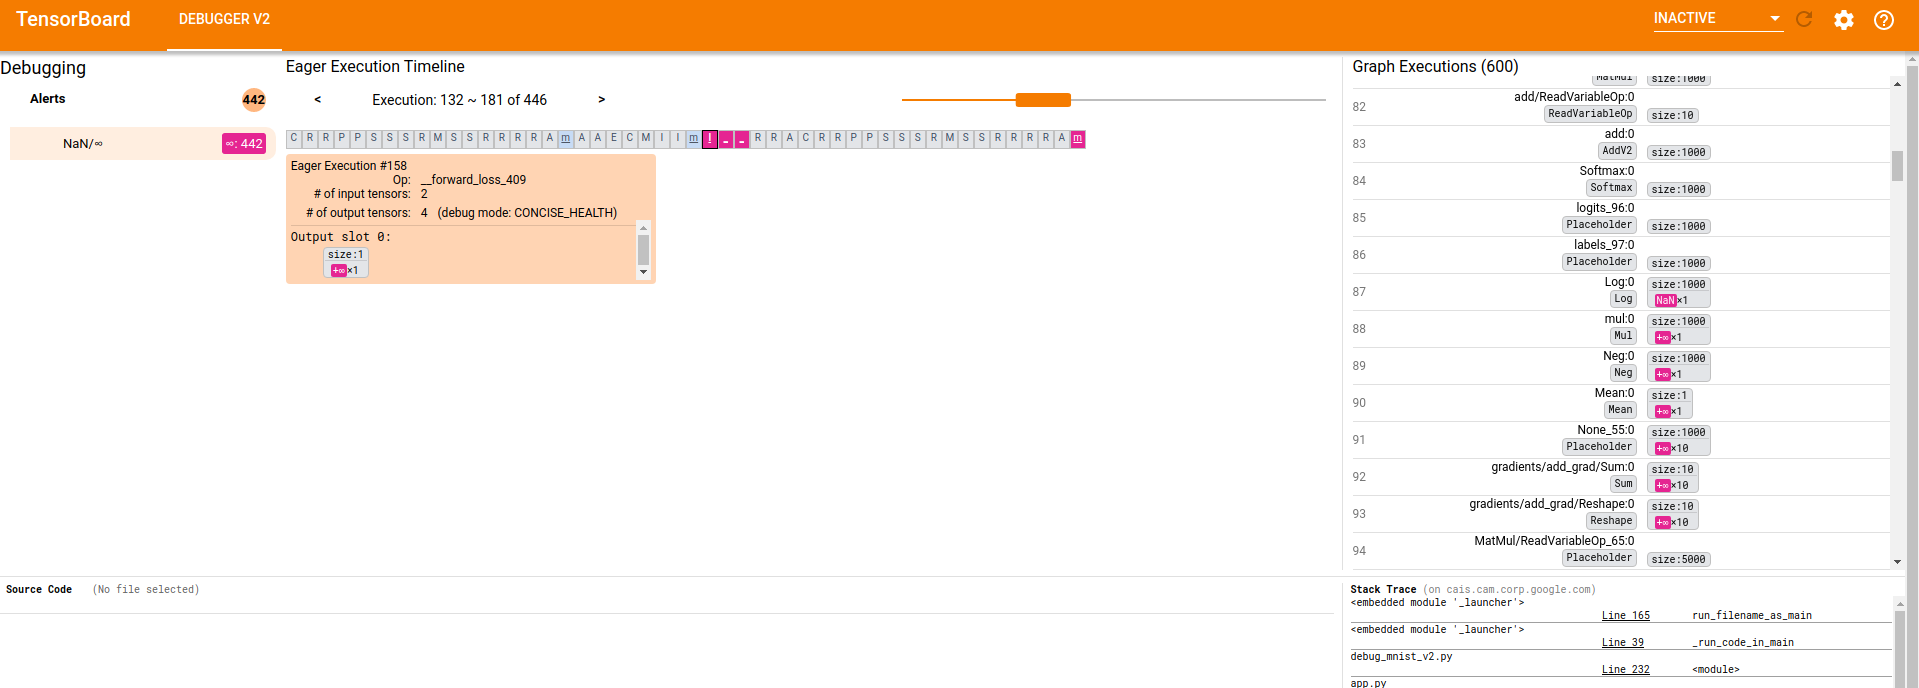 * SHAPE mode: 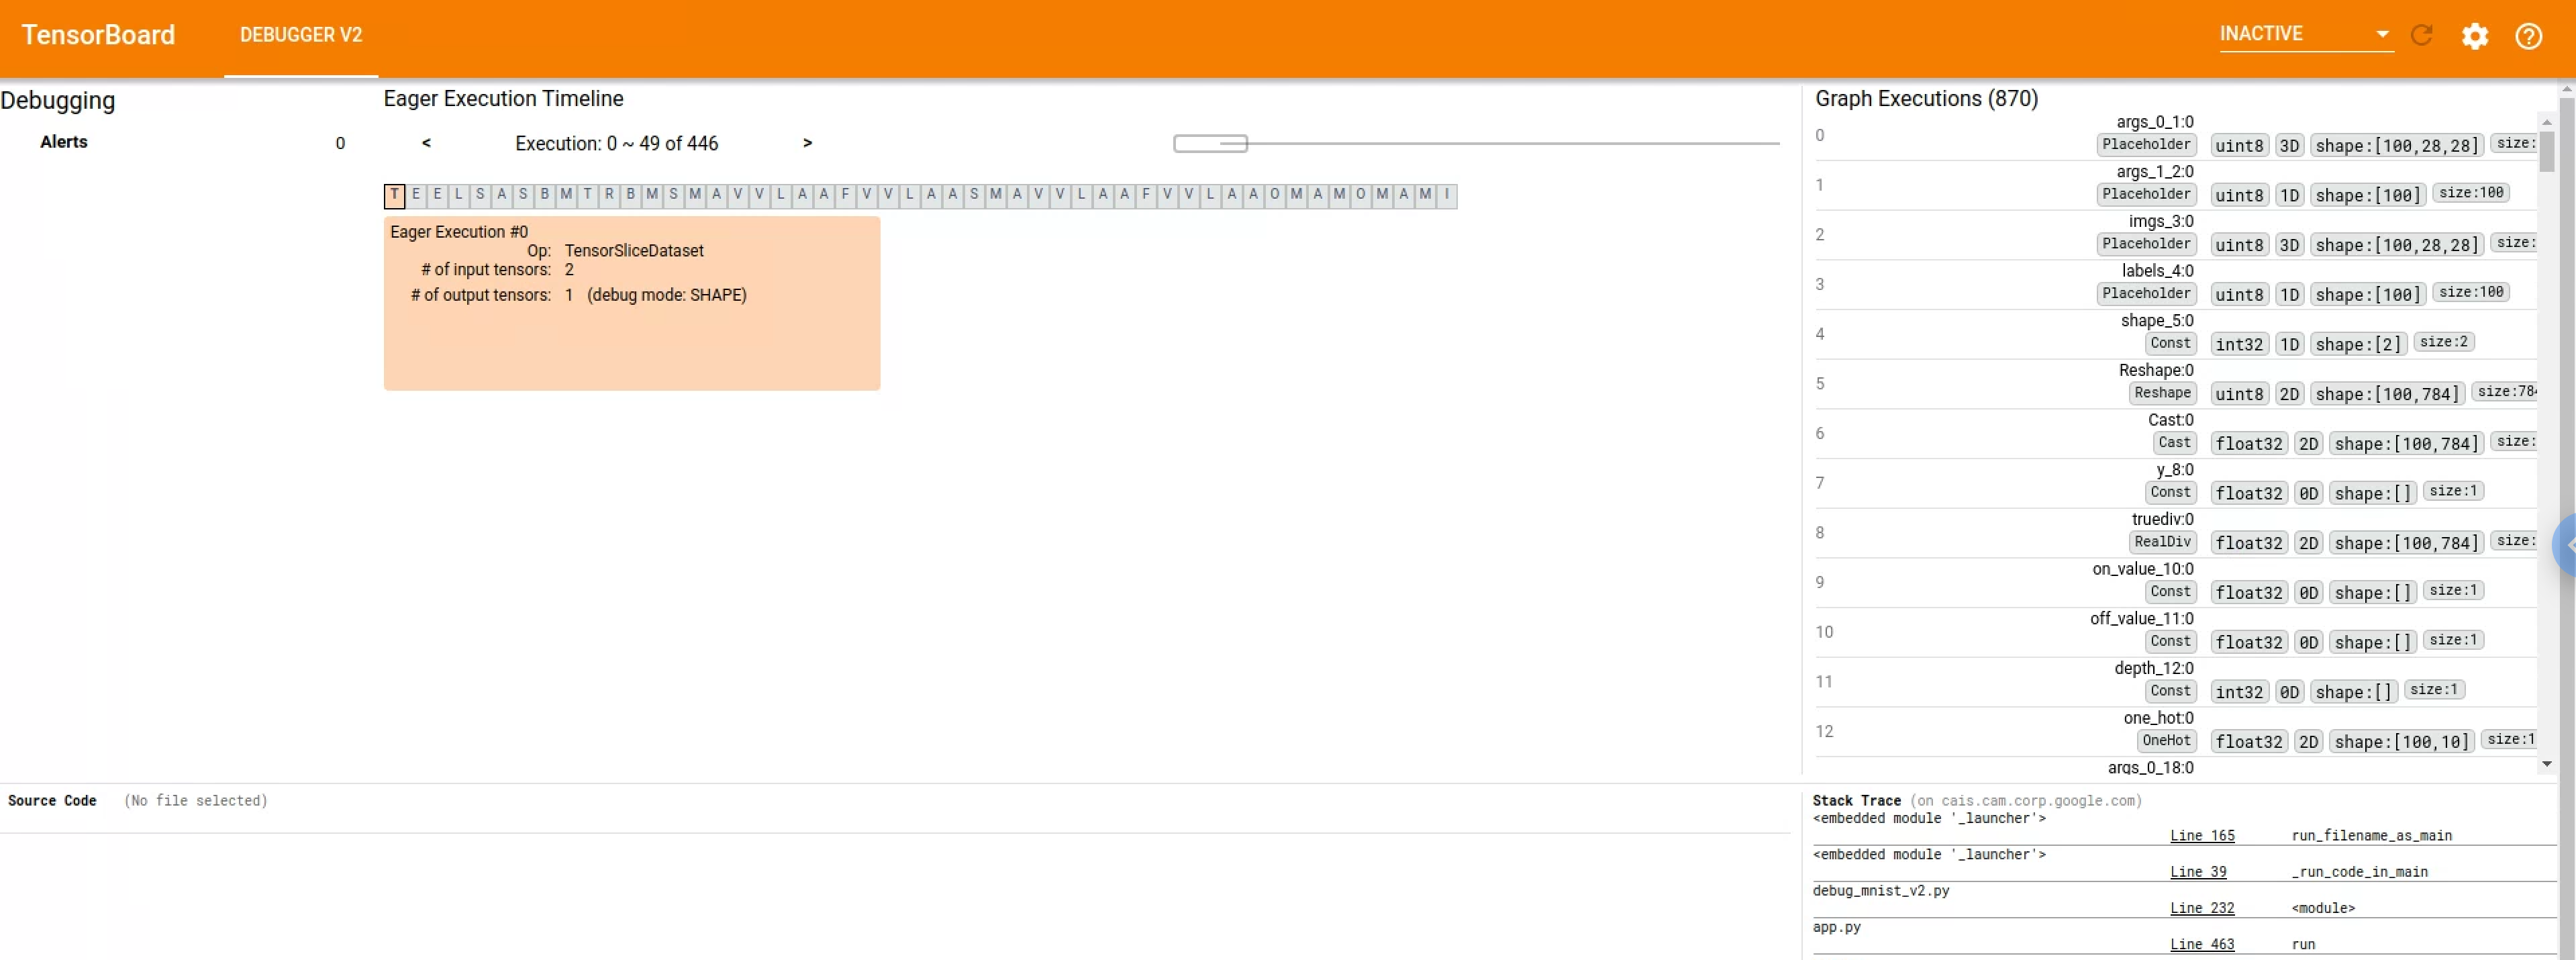 * FULL_HEALTH mode: 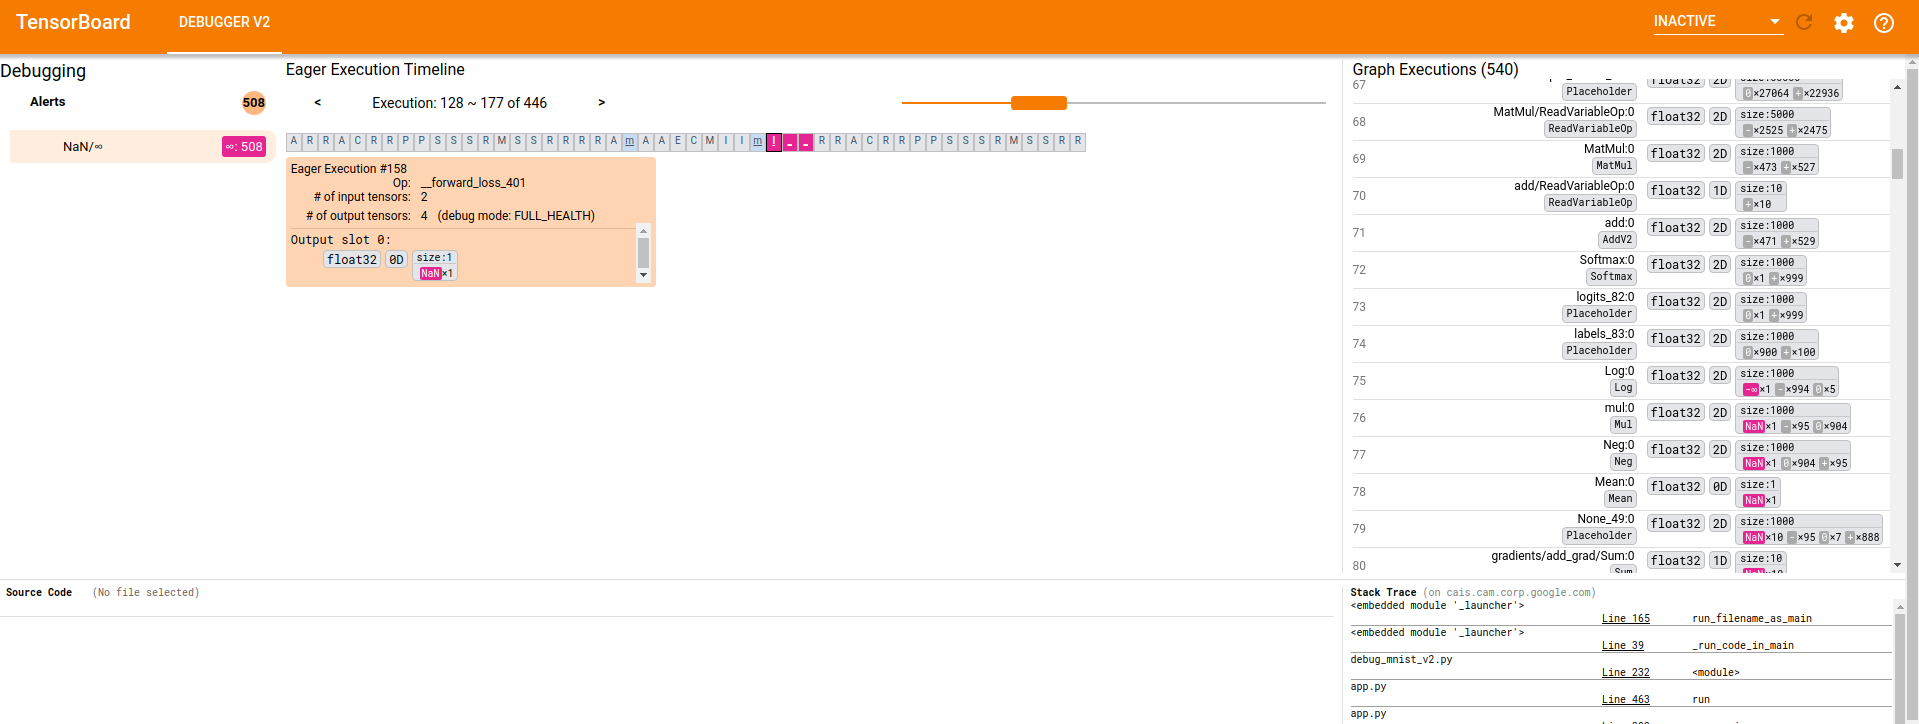 * Detailed steps to verify changes work correctly (as executed by you) * Unit tests are added for the new helper method and new component and its subcomponents * Manual verification against logdirs with real tfdbg2 data.
…tensorflow#3550) * Motivation for features / changes * Make it clearer in the StackFrameComponent which frame (if any) is being highlighted in the SourceCodeComponent. * Technical description of changes * In StackFrameContainer's internal selector, add a boolean field to the return value called `focused`. It is used in the template ng html to apply a CSS class (`.focused-stack-frame`) to the focused stack frame and only the focused stack frame. * While adding new unit test for the new feature, simplify existing ones by using `overrideSelector`. * To conform to style guide, replace `toEqual()` with `toBe()` where applicable in the touched unit tests. * Screenshots of UI changes * 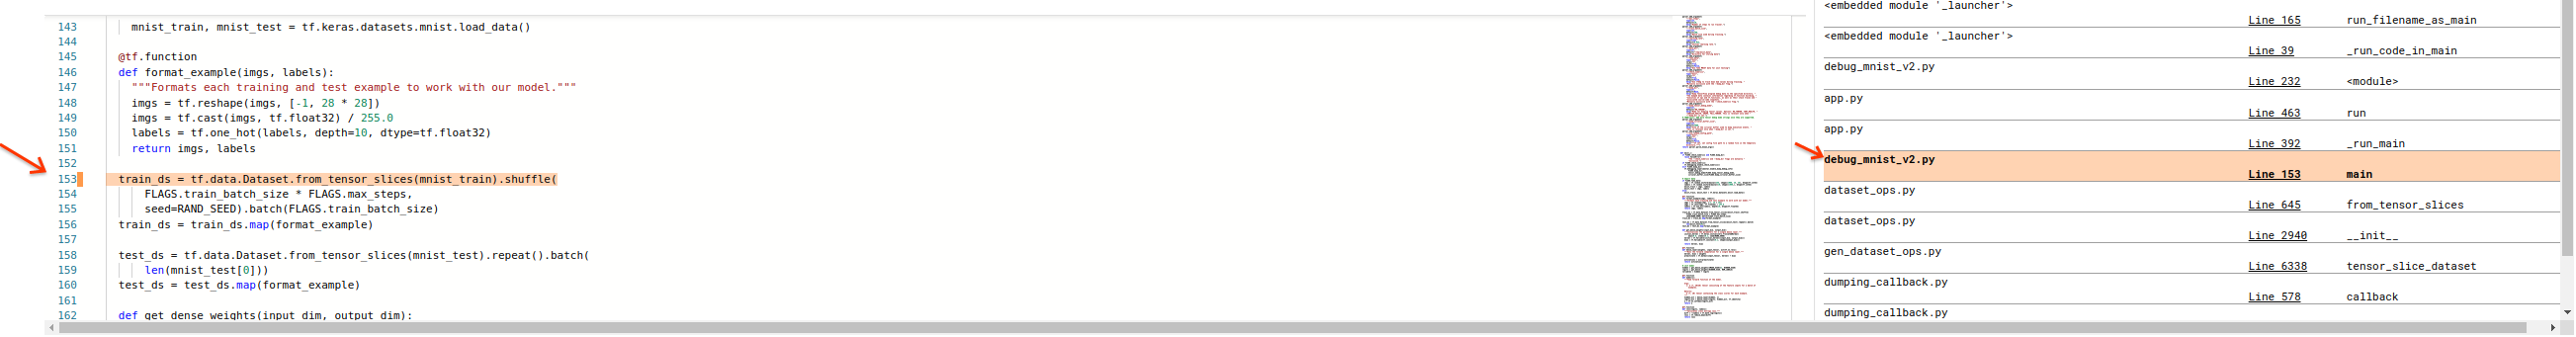 * Detailed steps to verify changes work correctly (as executed by you) * Unit test added * Existing unit tests for `StackFrameContainer` are simplified by replacing `setState()` with `overrideSelector()`.
RELEASE.md
Outdated
| available, so that it can be rendered via the Histograms plugin on | ||
| TensorBoard.dev | ||
| - May support additional plugins in the future, once those plugins are enabled | ||
| in the tensorboard.dev service. |
There was a problem hiding this comment.
Capitalization: TensorBoard.dev
|
A Googler has manually verified that the CLAs look good. (Googler, please make sure the reason for overriding the CLA status is clearly documented in these comments.) ℹ️ Googlers: Go here for more info. |
RELEASE.md
Outdated
| - The `tensorboard dev upload` subcommand now sends the histograms, when | ||
| available, so that it can be rendered via the Histograms plugin on | ||
| TensorBoard.dev | ||
| - May support additional plugins in the future, once those plugins are enabled |
There was a problem hiding this comment.
Since this section is ambiguous re uploader vs. server-side things, maybe be explicit: "This version of the uploader may support..."
|
All (the pull request submitter and all commit authors) CLAs are signed, but one or more commits were authored or co-authored by someone other than the pull request submitter. We need to confirm that all authors are ok with their commits being contributed to this project. Please have them confirm that by leaving a comment that contains only Note to project maintainer: There may be cases where the author cannot leave a comment, or the comment is not properly detected as consent. In those cases, you can manually confirm consent of the commit author(s), and set the ℹ️ Googlers: Go here for more info. |
|
A Googler has manually verified that the CLAs look good. (Googler, please make sure the reason for overriding the CLA status is clearly documented in these comments.) ℹ️ Googlers: Go here for more info. |
|
All (the pull request submitter and all commit authors) CLAs are signed, but one or more commits were authored or co-authored by someone other than the pull request submitter. We need to confirm that all authors are ok with their commits being contributed to this project. Please have them confirm that by leaving a comment that contains only Note to project maintainer: There may be cases where the author cannot leave a comment, or the comment is not properly detected as consent. In those cases, you can manually confirm consent of the commit author(s), and set the ℹ️ Googlers: Go here for more info. |
|
A Googler has manually verified that the CLAs look good. (Googler, please make sure the reason for overriding the CLA status is clearly documented in these comments.) ℹ️ Googlers: Go here for more info. |
Prepare for release 2.2.2, featuring the Histograms support in tensorboard.dev.
Cherry-pick command:
git cherry-pick 0f36c3fe..1b877f76