![]()
QTSBE is an open-source platform for backtesting quantitative trading strategies. It features a Python-based API built with Flask, offering multiple endpoints to facilitate seamless integration into existing projects.

- Comprehensive backtesting environment powered by NumPy and Pandas
- Flask-based API with caching system for optimized performance
- Interactive strategy visualization using Plotly
- Data integration with Yahoo Finance and Binance APIs
- Scanner tool for applying strategies across multiple cryptocurrencies and stocks
- Rich API endpoints for quick backtesting analysis and integration
-
Clone the repository:
git clone https://github.com/simonpotel/QTSBE
-
Install dependencies:
cd QTSBE
pip install -r requirements.txt
-
Implement Your Strategy
- Use the template in
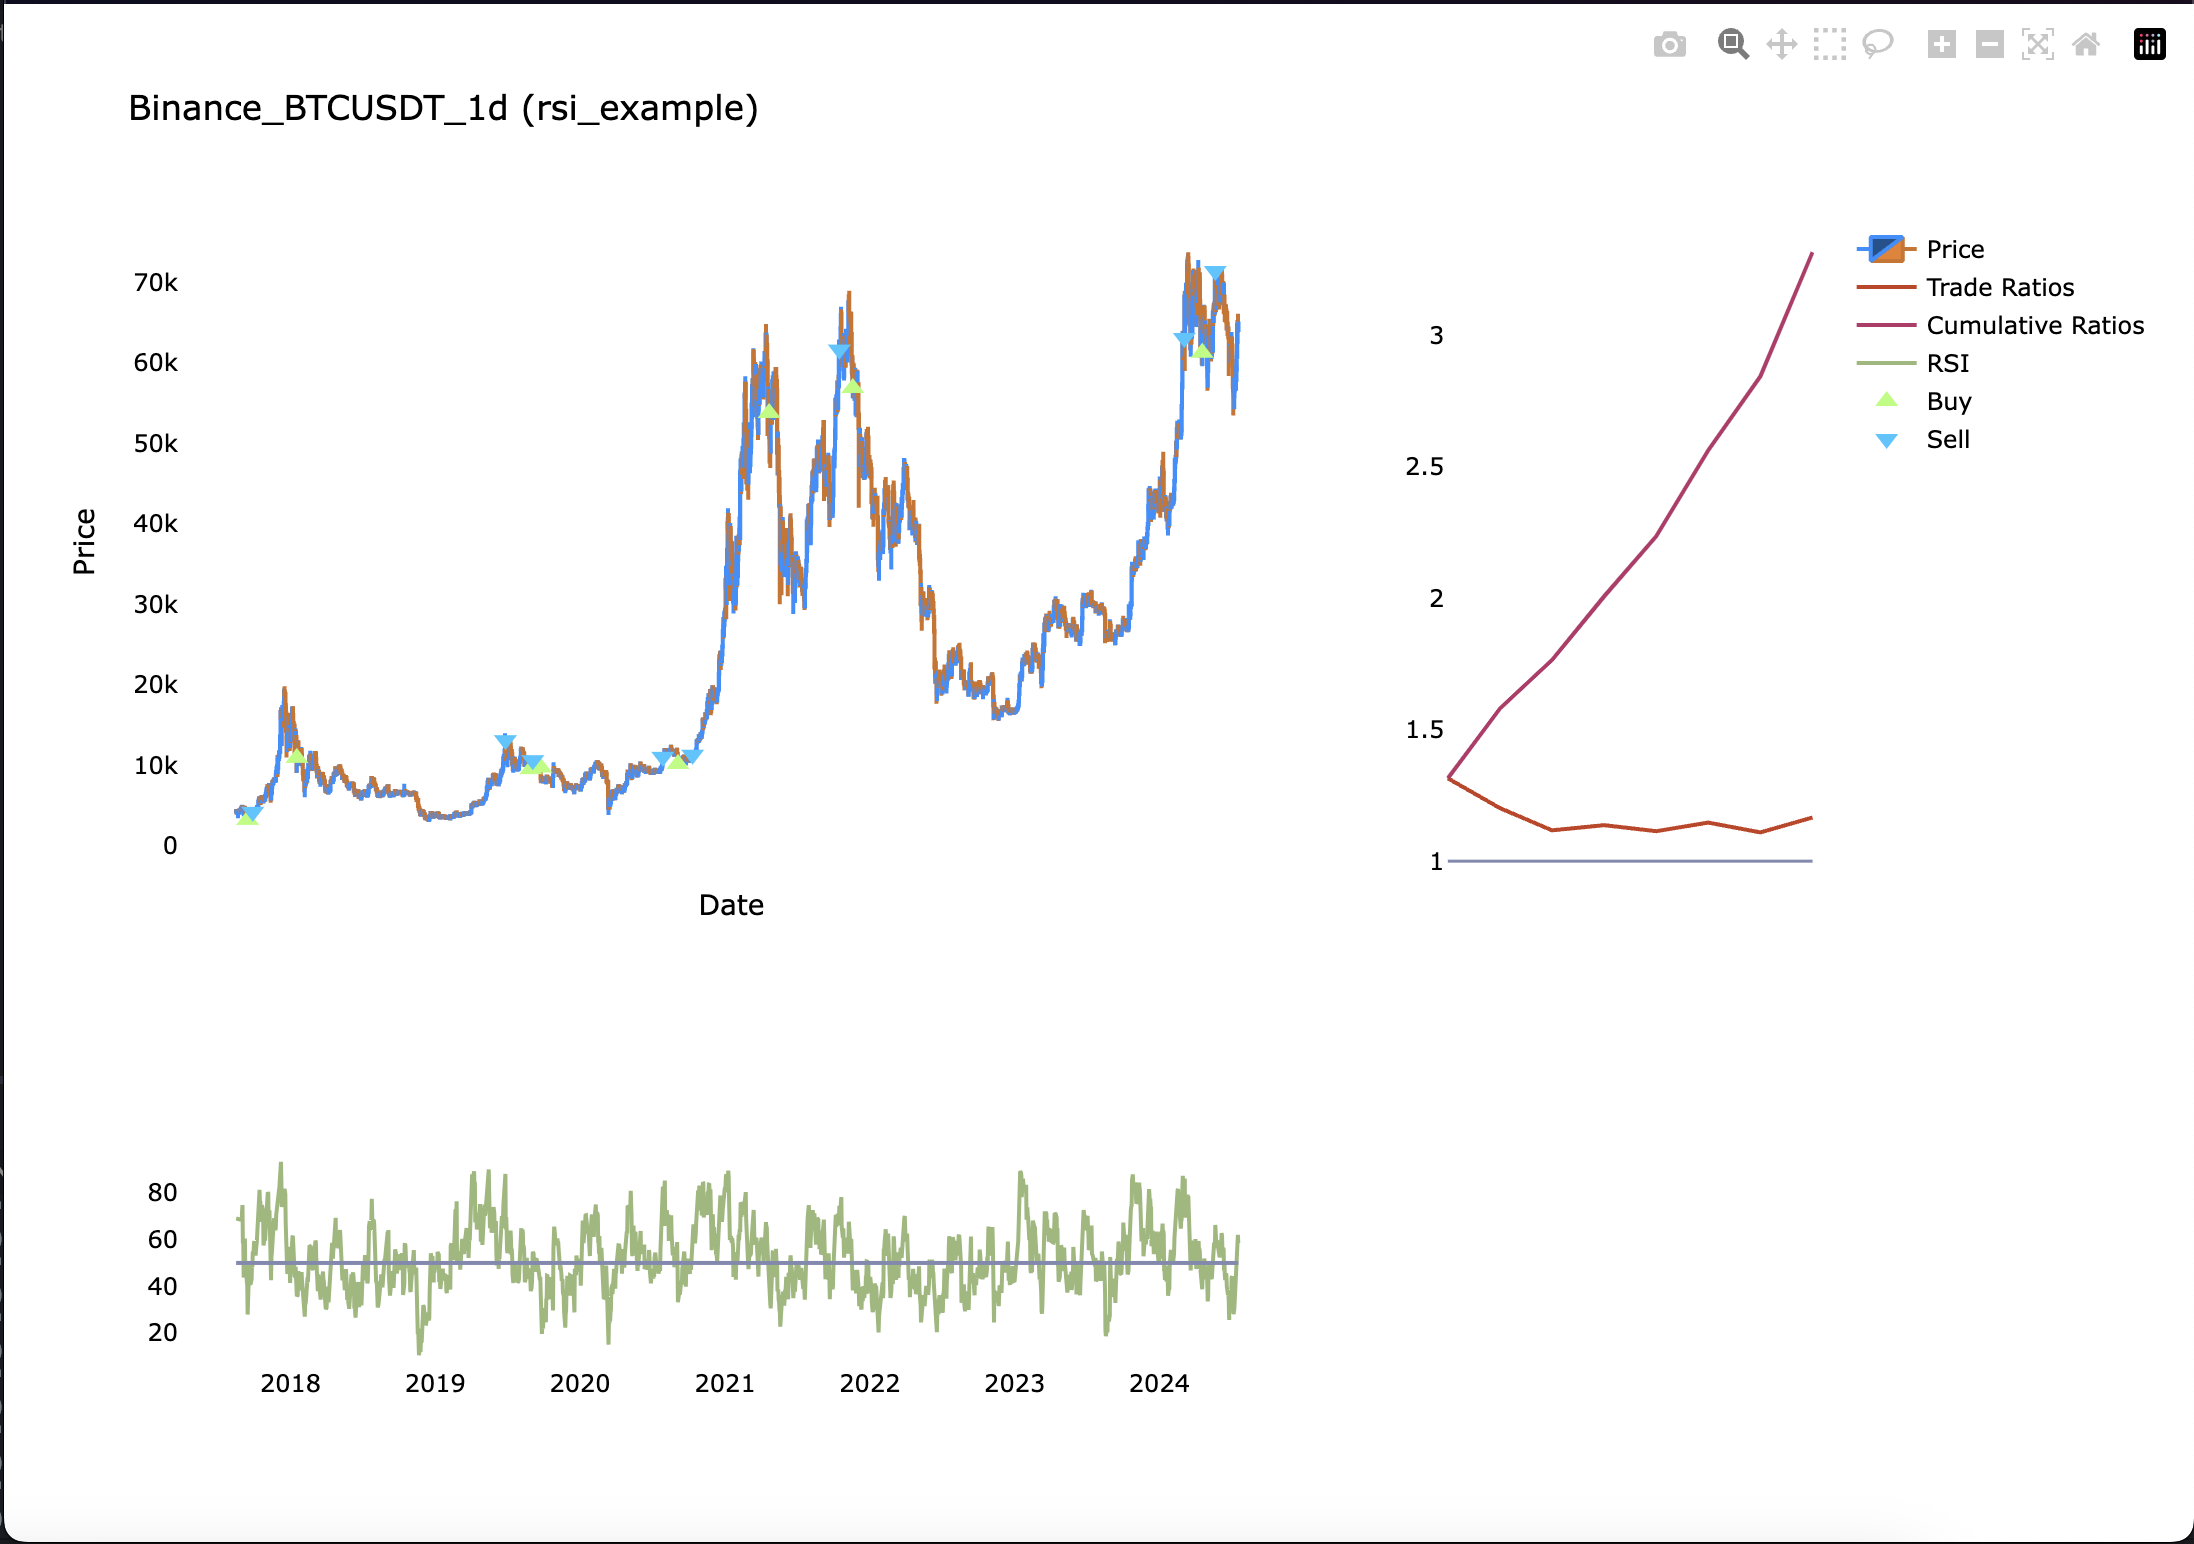
api/strategies/default.pyor refer toapi/strategies/rsi_example - Create a new Python file with an
analysefunction that returns the required data - Implement indicators directly in your code without including them in the JSON response
- Use the template in
-
Launch the API
python api/api.py
-
Available API Endpoints
- Get available tokens:
http://127.0.0.1:5000/QTSBE/get_tokens - List strategies:
http://127.0.0.1:5000/QTSBE/get_strategies - Run analysis:
http://127.0.0.1:5000/QTSBE/analyse - Custom analysis:
http://127.0.0.1:5000/QTSBE/analyse_custom(POST method)
Note: Replace
127.0.0.1:5000with your server's IP or domain name as needed. - Get available tokens:
-
Visualization Options
-
Generate Plotly charts:
sh tests/integrations/plotly_unit.sh
-
Use the Discord bot:
- Configure settings in
integrations/discord_chat_bot/bot.py - Launch the bot:
sh sh/discord_chat_bot.sh
- Configure settings in
-
Create custom interfaces (e.g., web interface) similar to the Smartswap project
-
-
Data Collection
- Configure
tools/auto_fetch/config.jsonfollowing instructions intools/auto_fetch/README.md - Run the auto-fetch tool:
sh sh/auto_fetch.sh
- Configure

- Automated trading bot that uses your strategy for live trading
- Dashboard to visualize your strategies with live data
- Alert system that notifies you of trading opportunities
- Scanner to find the best trading pairs for your strategy
- Tool to test and compare different trading strategies
This project is distributed under the MIT License. See the LICENSE file for details.
Caution
Please review all code thoroughly before implementation. Documentation and code purposes may not be current. The developers are not liable for any financial losses, calculation errors, or related issues that may occur from using this software.
For questions or support, connect with me on LinkedIn.