Polar 2.0 #2200
There are no files selected for viewing
This file contains bidirectional Unicode text that may be interpreted or compiled differently than what appears below. To review, open the file in an editor that reveals hidden Unicode characters.
Learn more about bidirectional Unicode characters
| Original file line number | Diff line number | Diff line change |
|---|---|---|
| @@ -0,0 +1,327 @@ | ||
| /** | ||
| * Copyright 2012-2017, Plotly, Inc. | ||
| * All rights reserved. | ||
| * | ||
| * This source code is licensed under the MIT license found in the | ||
| * LICENSE file in the root directory of this source tree. | ||
| */ | ||
|
|
||
| 'use strict'; | ||
|
|
||
| var colorAttrs = require('../../components/color/attributes'); | ||
| var axesAttrs = require('../cartesian/layout_attributes'); | ||
| var extendFlat = require('../../lib').extendFlat; | ||
| var overrideAll = require('../../plot_api/edit_types').overrideAll; | ||
|
|
||
| var domainItem = { | ||
| valType: 'info_array', | ||
| role: 'info', | ||
| editType: 'plot', | ||
| items: [ | ||
| {valType: 'number', min: 0, max: 1}, | ||
| {valType: 'number', min: 0, max: 1} | ||
| ], | ||
| dflt: [0, 1] | ||
| }; | ||
|
|
||
| var axisLineGridAttr = overrideAll({ | ||
| color: axesAttrs.color, | ||
| showline: extendFlat({}, axesAttrs.showline, {dflt: true}), | ||
| linecolor: axesAttrs.linecolor, | ||
| linewidth: axesAttrs.linewidth, | ||
| showgrid: extendFlat({}, axesAttrs.showgrid, {dflt: true}), | ||
| gridcolor: axesAttrs.gridcolor, | ||
| gridwidth: axesAttrs.gridwidth | ||
|
|
||
| // should we add zeroline* attributes? | ||
| // might be useful on radial axes where range is negative and positive | ||
|
|
||
| // we could add spike* attributes down the road | ||
| }, 'plot', 'from-root'); | ||
|
|
||
| var axisTickAttr = overrideAll({ | ||
| tickmode: axesAttrs.tickmode, | ||
| nticks: axesAttrs.nticks, | ||
| tick0: axesAttrs.tick0, | ||
| dtick: axesAttrs.dtick, | ||
| tickvals: axesAttrs.tickvals, | ||
| ticktext: axesAttrs.ticktext, | ||
| ticks: axesAttrs.ticks, | ||
| ticklen: axesAttrs.ticklen, | ||
| tickwidth: axesAttrs.tickwidth, | ||
| tickcolor: axesAttrs.tickcolor, | ||
| showticklabels: axesAttrs.showticklabels, | ||
| showtickprefix: axesAttrs.showtickprefix, | ||
| tickprefix: axesAttrs.tickprefix, | ||
| showticksuffix: axesAttrs.showticksuffix, | ||
| ticksuffix: axesAttrs.ticksuffix, | ||
| showexponent: axesAttrs.showexponent, | ||
| exponentformat: axesAttrs.exponentformat, | ||
| separatethousands: axesAttrs.separatethousands, | ||
| tickfont: axesAttrs.tickfont, | ||
| tickangle: axesAttrs.tickangle, | ||
| tickformat: axesAttrs.tickformat, | ||
| tickformatstops: axesAttrs.tickformatstops, | ||
| }, 'plot', 'from-root'); | ||
|
|
||
| var radialAxisAttrs = { | ||
| visible: extendFlat({}, axesAttrs.visible, {dflt: true}), | ||
| type: axesAttrs.type, | ||
|
|
||
| // You thought maybe that range should only be a 'max' instead | ||
| // as it always starts at 0? But, looks like off-zero cutout polar chart are | ||
| // a thing: | ||
| // -> mpl allow radial ranges to start off 0 | ||
| // -> same for matlab: https://www.mathworks.com/help/matlab/ref/rlim.html | ||
| autorange: axesAttrs.autorange, | ||
| // might make 'nonnegative' the default, | ||
| // or add a special polar algo. | ||
| rangemode: axesAttrs.rangemode, | ||
| range: axesAttrs.range, | ||
|
|
||
| categoryorder: axesAttrs.categoryorder, | ||
| categoryarray: axesAttrs.categoryarray, | ||
|
|
||
| // position (name analogous to xaxis.position), | ||
| // or maybe something more specific e.g. angle angleoffset? | ||
| // | ||
| // (should this support any data coordinate system?) | ||
| // I think it is more intuitive to set this as just an angle! | ||
| // Thoughts? | ||
| position: { | ||
| valType: 'angle', | ||
| editType: 'plot', | ||
| role: 'info', | ||
| description: [ | ||
| 'Sets the angle (in degrees) from which the radial axis is drawn.', | ||
| 'Note that by default, radial axis line on the theta=0 line', | ||
| 'corresponds to a line pointing right (like what mathematicians prefer).', | ||
| 'Defaults to the first `polar.sector` angle.' | ||
| ].join(' ') | ||
| }, | ||
|
|
||
| side: { | ||
| valType: 'enumerated', | ||
| // maybe 'clockwise' and 'counterclockwise' would be best here | ||
| values: ['left', 'right'], | ||
| dflt: 'right', | ||
| editType: 'plot', | ||
| role: 'info', | ||
| description: [ | ||
| 'Determines on which side of radial axis line', | ||
| 'the tick and tick labels appear.' | ||
| ].join(' ') | ||
| }, | ||
|
|
||
| // not sure about these | ||
| // maybe just for radialaxis ?? | ||
| title: axesAttrs.title, | ||
| titlefont: axesAttrs.titlefont, | ||
|
|
||
| // only applies to radial axis for now (i.e. for cliponaxis: false traces) | ||
| // but angular.layer could be a thing later | ||
| layer: axesAttrs.layer, | ||
|
|
||
| hoverformat: axesAttrs.hoverformat, | ||
|
|
||
| // More attributes: | ||
|
|
||
| // We'll need some attribute that determines the span | ||
| // to draw donut-like charts | ||
| // e.g. https://github.com/matplotlib/matplotlib/issues/4217 | ||
| // | ||
| // maybe something like 'span' or 'hole' (like pie, but pie set it in data coords?) | ||
| // span: {}, | ||
| // hole: 1 | ||
|
|
||
| // maybe should add a boolean to enable square grid lines | ||
| // and square axis lines | ||
| // (most common in radar-like charts) | ||
| // e.g. squareline/squaregrid or showline/showgrid: 'square' (on-top of true) | ||
|
|
||
| editType: 'calc' | ||
| }; | ||
|
|
||
| extendFlat( | ||
| radialAxisAttrs, | ||
|
|
||
| // N.B. the radialaxis grid lines are circular, | ||
| // but radialaxis lines are straight from circle center to outer bound | ||
| axisLineGridAttr, | ||
| axisTickAttr | ||
| ); | ||
|
|
||
| var angularAxisAttrs = { | ||
| visible: extendFlat({}, axesAttrs.visible, {dflt: true}), | ||
| type: { | ||
| valType: 'enumerated', | ||
| // 'linear' should maybe be called 'angle' or 'angular' here | ||
| // to make clear that axis here is periodic and more tightly match | ||
| // `thetaunit`? | ||
| // | ||
| // no 'log' for now | ||
| values: ['-', 'linear', 'date', 'category'], | ||
| dflt: '-', | ||
| role: 'info', | ||
| editType: 'calc', | ||
| description: [ | ||
| 'Sets the angular axis type.', | ||
| 'If *linear*, set `thetaunit` to determine the unit in which axis value are shown.', | ||
| 'If *date*, set `period` to determine the wrap around period.', | ||
| 'If *category, set `period` to determine the number of integer coordinates around polar axis.' | ||
| ].join(' ') | ||
| }, | ||
|
|
||
| categoryorder: axesAttrs.categoryorder, | ||
| categoryarray: axesAttrs.categoryarray, | ||
|
|
||
| thetaunit: { | ||
| valType: 'enumerated', | ||
| values: ['radians', 'degrees'], | ||
| dflt: 'degrees', | ||
| role: 'info', | ||
| editType: 'calc', | ||
| description: [ | ||
| 'Sets the format unit of the formatted *theta* values.', | ||
| 'Has an effect only when `angularaxis.type` is *linear*.' | ||
| ].join(' ') | ||
| }, | ||
|
|
||
| period: { | ||
| valType: 'any', | ||
| editType: 'calc', | ||
| role: 'info', | ||
| description: '' | ||
|
|
||
| // 360 / 2*pi for linear (might not need to set it) | ||
| // and to full range for other types | ||
|
|
||
| // 'period' is the angular equivalent to 'range' | ||
|
|
||
| // similar to dtick, one way to achieve e.g.: | ||
| // - period that equals the timeseries length | ||
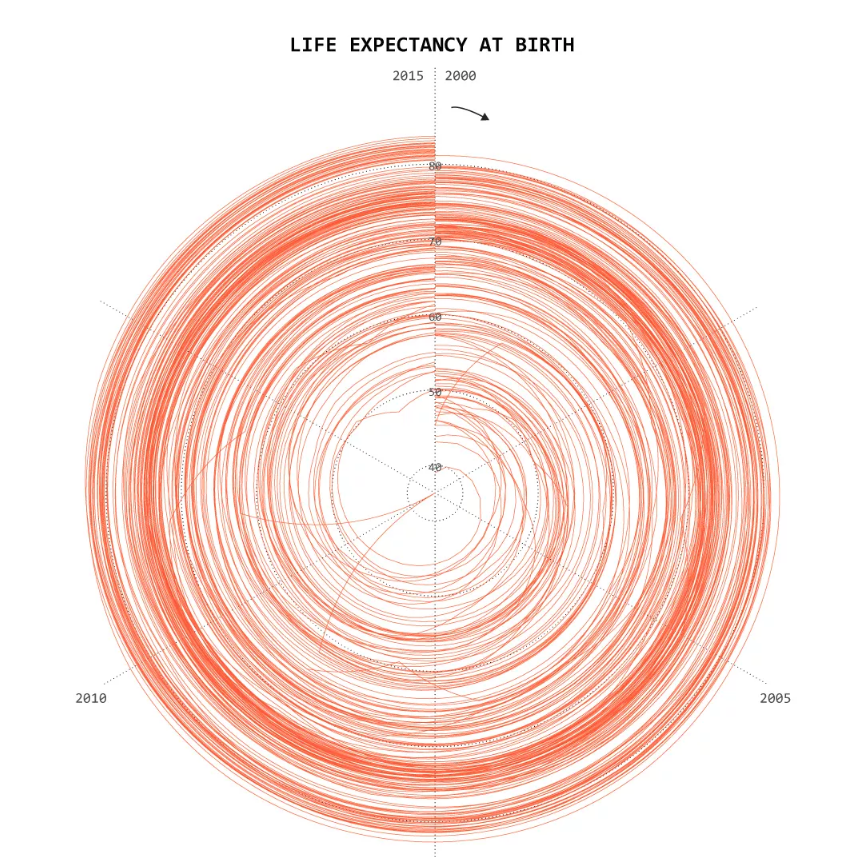
| // http://flowingdata.com/2017/01/24/one-dataset-visualized-25-ways/18-polar-coordinates/ | ||
| // - and 1-year periods (focusing on seasonal change0 | ||
| // http://otexts.org/fpp2/seasonal-plots.html | ||
| // https://blogs.scientificamerican.com/sa-visual/why-are-so-many-babies-born-around-8-00-a-m/ | ||
| // http://www.seasonaladjustment.com/2012/09/05/clock-plot-visualising-seasonality-using-r-and-ggplot2-part-3/ | ||
| // https://i.pinimg.com/736x/49/b9/72/49b972ccb3206a1a6d6f870dac543280.jpg | ||
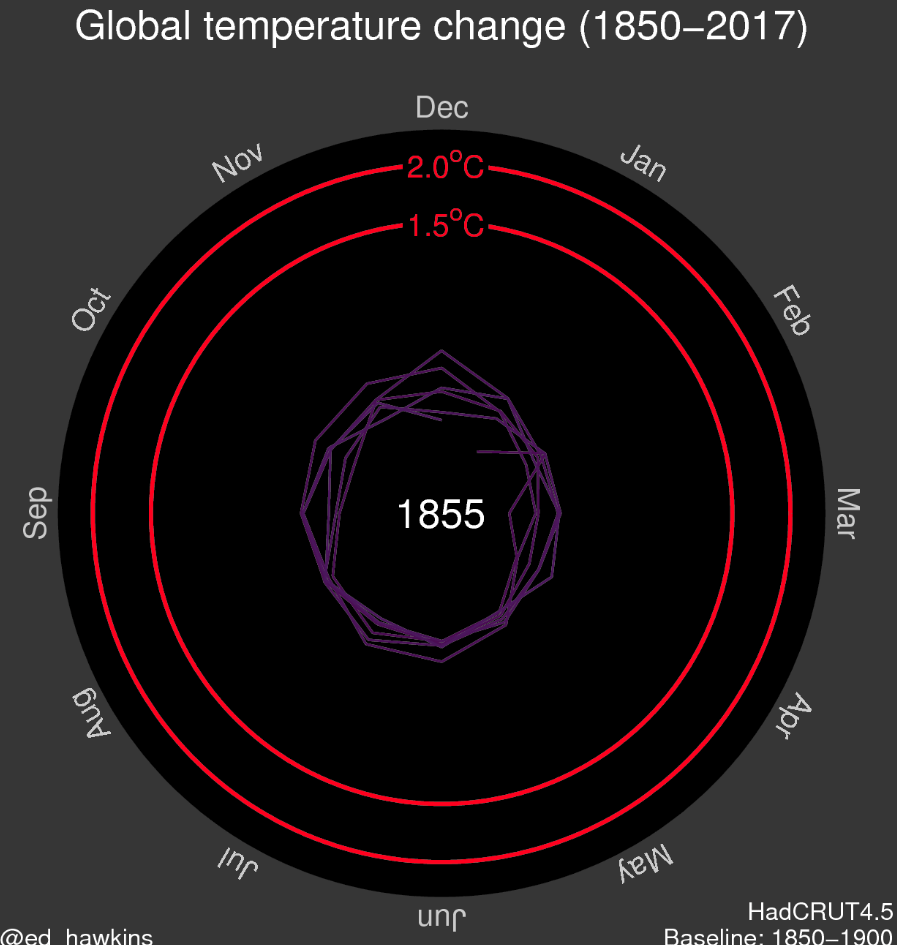
| // https://www.climate-lab-book.ac.uk/spirals/ | ||
| }, | ||
|
There was a problem hiding this comment. Some screenshot of date angular axes:
There was a problem hiding this comment. Great feature !! Can you please include the code (layout config attributes) for the above example screenshots? |
||
|
|
||
| direction: { | ||
| valType: 'enumerated', | ||
| values: ['counterclockwise', 'clockwise'], | ||
| // we could make the default 'clockwise' for date axes ... | ||
| dflt: 'counterclockwise', | ||
| role: 'info', | ||
| editType: 'calc', | ||
| description: [ | ||
| 'Sets the direction corresponding to positive angles.' | ||
| ].join(' ') | ||
| }, | ||
|
|
||
| // matlab uses thetaZeroLocation: 'North', 'West', 'East', 'South' | ||
| // mpl uses set_theta_zero_location('W', offset=10) | ||
| // | ||
| // position is analogous to yaxis.position, but as an angle (going | ||
| // counterclockwise about cartesian y=0. | ||
| position: { | ||
| valType: 'angle', | ||
| // we could maybe make `position: 90` by default for category and date angular axes. | ||
| dflt: 0, | ||
| editType: 'calc', | ||
| role: 'info', | ||
| description: [ | ||
| 'Sets that start position (in degrees) of the angular axis', | ||
| 'Note that by default, polar subplots are orientation such that the theta=0', | ||
| 'corresponds to a line pointing right (like what mathematicians prefer).', | ||
| 'For example to make the angular axis start from the North (like on a compass),', | ||
| 'set `angularaxis.position` to *90*.' | ||
| ].join(' ') | ||
| }, | ||
|
|
||
| hoverformat: axesAttrs.hoverformat, | ||
|
|
||
| editType: 'calc' | ||
| }; | ||
|
|
||
| extendFlat( | ||
| angularAxisAttrs, | ||
|
|
||
| // N.B. the angular grid lines are straight lines from circle center to outer bound | ||
| // the angular line is circular bounding the polar plot area. | ||
| axisLineGridAttr, | ||
| // Note that ticksuffix defaults to '°' for angular axes with `thetaunit: 'degrees'` | ||
| axisTickAttr | ||
| ); | ||
|
|
||
| module.exports = { | ||
| // AJ and I first thought about a x/y/zoom system for paper-based zooming | ||
| // but I came to think that sector span + radial axis range | ||
| // zooming will be better | ||
| // | ||
| // TODO confirm with team. | ||
| // x: {}, | ||
| // y: {}, | ||
| // zoom: {}, | ||
|
|
||
| domain: { | ||
| x: extendFlat({}, domainItem, { | ||
| description: [ | ||
| 'Sets the horizontal domain of this subplot', | ||
| '(in plot fraction).' | ||
| ].join(' ') | ||
| }), | ||
| y: extendFlat({}, domainItem, { | ||
| description: [ | ||
| 'Sets the vertical domain of this subplot', | ||
| '(in plot fraction).' | ||
| ].join(' ') | ||
| }), | ||
| editType: 'plot' | ||
| }, | ||
|
|
||
| // Maybe this should angularaxis.range correspond to | ||
| // angular span of the drawing area? | ||
| // | ||
| // matlab's angular equivalent to 'range' bounds the drawing area | ||
| // (partial circles as they call it) | ||
| // https://www.mathworks.com/help/matlab/ref/thetalim.html | ||
| // | ||
| // as this attribute would be best set in (absolute) angles, | ||
| // I think this should be set outside of angularaxis e.g | ||
| // as polar.sector: [0, 180] | ||
| sector: { | ||
| valType: 'info_array', | ||
| items: [ | ||
| // or be more strict -> `valType: 'angle' with `dflt: [0, 360]` | ||
| {valType: 'number', editType: 'plot'}, | ||
| {valType: 'number', editType: 'plot'} | ||
| ], | ||
| dflt: [0, 360], | ||
| role: 'info', | ||
| editType: 'plot', | ||
| description: [ | ||
| 'Sets angular span of this polar subplot with two angles (in degrees).', | ||
| 'Sector are assumed to be spanned in the counterclockwise direction', | ||
| 'with *0* corresponding to rightmost limit of the polar subplot.' | ||
| ].join(' ') | ||
| }, | ||
|
|
||
| bgcolor: { | ||
| valType: 'color', | ||
| role: 'style', | ||
| editType: 'plot', | ||
| dflt: colorAttrs.background, | ||
| description: 'Set the background color of the subplot' | ||
| }, | ||
|
|
||
| radialaxis: radialAxisAttrs, | ||
| angularaxis: angularAxisAttrs, | ||
|
|
||
| // TODO maybe? | ||
| // annotations: | ||
|
|
||
| editType: 'calc' | ||
| }; | ||


Add this suggestion to a batch that can be applied as a single commit.
This suggestion is invalid because no changes were made to the code.
Suggestions cannot be applied while the pull request is closed.
Suggestions cannot be applied while viewing a subset of changes.
Only one suggestion per line can be applied in a batch.
Add this suggestion to a batch that can be applied as a single commit.
Applying suggestions on deleted lines is not supported.
You must change the existing code in this line in order to create a valid suggestion.
Outdated suggestions cannot be applied.
This suggestion has been applied or marked resolved.
Suggestions cannot be applied from pending reviews.
Suggestions cannot be applied on multi-line comments.
Suggestions cannot be applied while the pull request is queued to merge.
Suggestion cannot be applied right now. Please check back later.
There was a problem hiding this comment.
Choose a reason for hiding this comment
The reason will be displayed to describe this comment to others. Learn more.
e.g. in matlab: