Document Getting Started with Prometheus and Grafana #1396
There are no files selected for viewing
This file contains bidirectional Unicode text that may be interpreted or compiled differently than what appears below. To review, open the file in an editor that reveals hidden Unicode characters.
Learn more about bidirectional Unicode characters
| Original file line number | Diff line number | Diff line change | ||||
|---|---|---|---|---|---|---|
| @@ -0,0 +1,211 @@ | ||||||
| # Getting Started with Prometheus and Grafana | ||||||
|
|
||||||
| - [Export metrics from the application](#export-metrics-from-the-application) | ||||||
| - [Check results in the browser](#check-results-in-the-browser) | ||||||
| - [Collect metrics using Prometheus](#collect-metrics-using-prometheus) | ||||||
| - [Configuration](#configuration) | ||||||
| - [Start Prometheus](#start-prometheus) | ||||||
| - [View results in Prometheus](#view-results-in-prometheus) | ||||||
| - [Explore metrics using Grafana](#explore-metrics-using-grafana) | ||||||
| - [Learn more](#learn-more) | ||||||
|
|
||||||
| ## Export metrics from the application | ||||||
|
|
||||||
| It is highly recommended to go over the [ostream-metrics](../metrics_simple/README.md) | ||||||
| doc before following along this document. | ||||||
|
|
||||||
| Create a new console application and run it: | ||||||
|
|
||||||
| ```sh | ||||||
| bazel run //examples/prometheus:prometheus_example | ||||||
| ``` | ||||||
|
|
||||||
| Now, we are going to make some small tweaks to the example in the | ||||||
| ostream-metrics to make the metrics available via | ||||||
| OpenTelemetry Prometheus Exporter. | ||||||
|
|
||||||
| And replace the below line: | ||||||
|
|
||||||
| ```cpp | ||||||
| std::unique_ptr<metric_sdk::MetricExporter> exporter{ | ||||||
| new exportermetrics::OStreamMetricExporter}; | ||||||
|
|
||||||
| ``` | ||||||
|
|
||||||
| with | ||||||
|
|
||||||
| ```cpp | ||||||
| std::unique_ptr<metrics_sdk::MetricExporter> exporter{ | ||||||
| new metrics_exporter::PrometheusExporter(opts)}; | ||||||
| ``` | ||||||
|
|
||||||
| OpenTelemetry `PrometheusExporter` will export | ||||||
| data via the endpoint defined by | ||||||
| `metrics_exporter::PrometheusExporterOptions::url`, | ||||||
| which is `http://localhost:8080/` by default. | ||||||
|
There was a problem hiding this comment. Not directly related to this PR, consider changing the default port following https://github.com/open-telemetry/opentelemetry-specification/blob/main/specification/sdk-environment-variables.md#prometheus-exporter (note that the spec is still Experimental). |
||||||
|
|
||||||
| ```mermaid | ||||||
| graph LR | ||||||
|
|
||||||
| subgraph SDK | ||||||
| MeterProvider | ||||||
| MetricReader[PeriodicExportingMetricReader] | ||||||
| PrometheusExporter["PrometheusExporter<br/>(http://localhost:8080/)"] | ||||||
| end | ||||||
|
|
||||||
| subgraph API | ||||||
| Instrument["Meter(#quot;prometheus_metric_example#quot;, #quot;1.0#quot;)<br/>Histogram(#quot;prometheus_metric_example_histogram#quot;)"] | ||||||
| end | ||||||
|
|
||||||
| Instrument --> | Measurements | MeterProvider | ||||||
|
|
||||||
| MeterProvider --> | Metrics | MetricReader --> | Pull | PrometheusExporter | ||||||
| ``` | ||||||
|
|
||||||
| Also, for our learning purpose, use a while-loop to keep recoring random | ||||||
| values until the program stopped. | ||||||
|
|
||||||
| ```cpp | ||||||
| while (true) | ||||||
| { | ||||||
| double val = (rand() % 700) + 1.1; | ||||||
| std::map<std::string, std::string> labels = get_random_attr(); | ||||||
| auto labelkv = opentelemetry::common::KeyValueIterableView<decltype(labels)>{labels}; | ||||||
| histogram_counter->Record(val, labelkv, context); | ||||||
| std::this_thread::sleep_for(std::chrono::milliseconds(50)); | ||||||
| } | ||||||
| ``` | ||||||
|
|
||||||
| ### Check results in the browser | ||||||
|
|
||||||
| Start the application and keep it running. Now we should be able to see the | ||||||
| metrics at [http://localhost:8080/metrics](http://localhost:9464/metrics) from a | ||||||
| web browser: | ||||||
|
|
||||||
| 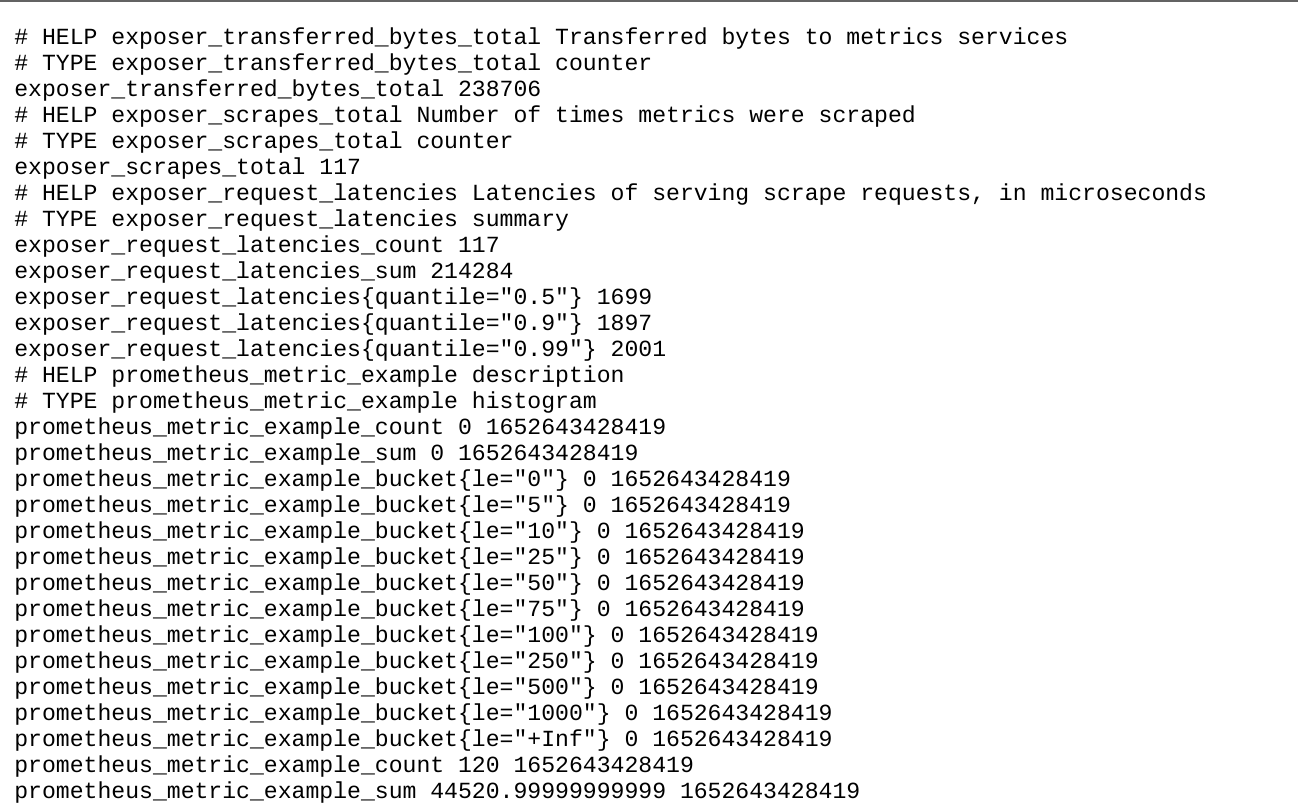 | ||||||
|
|
||||||
| Now, we understand how we can configure `PrometheusExporter` to export metrics. | ||||||
| Next, we are going to learn about how to use Prometheus to collect the metrics. | ||||||
|
|
||||||
| ## Collect metrics using Prometheus | ||||||
|
|
||||||
| Follow the [first steps](https://prometheus.io/docs/introduction/first_steps/) | ||||||
| to download the [latest release](https://prometheus.io/download/) of Prometheus. | ||||||
|
|
||||||
| ### Configuration | ||||||
|
|
||||||
| After finished downloading, extract it to a local location that's easy to | ||||||
esigo marked this conversation as resolved.
Show resolved
Hide resolved
|
||||||
| access. We will find the default Prometheus configuration YAML file in the | ||||||
| folder, named `prometheus.yml`. | ||||||
|
|
||||||
| Let's create a new file in the same location as where `prometheus.yml`. Then, | ||||||
| copy and paste the entire content below into the `prometheus.yml` file | ||||||
| we have created just now. | ||||||
|
|
||||||
| ```yaml | ||||||
| global: | ||||||
| scrape_interval: 5s | ||||||
| scrape_timeout: 2s | ||||||
| evaluation_interval: 5s | ||||||
| alerting: | ||||||
| alertmanagers: | ||||||
| - follow_redirects: true | ||||||
| scheme: http | ||||||
| timeout: 5s | ||||||
| api_version: v2 | ||||||
| static_configs: | ||||||
| - targets: [localhost:8080] | ||||||
| scrape_configs: | ||||||
| - job_name: otel | ||||||
| static_configs: | ||||||
| - targets: ['localhost:8080'] | ||||||
| ``` | ||||||
|
|
||||||
| ### Start Prometheus | ||||||
|
|
||||||
| Follow the instructions from | ||||||
| [starting-prometheus](https://prometheus.io/docs/introduction/first_steps/#starting-prometheus) | ||||||
| to start the Prometheus server and verify it has been started successfully. | ||||||
|
|
||||||
| Please note that we will need pass in `prometheus.yml` file as the argument | ||||||
| or mount as volume: | ||||||
|
|
||||||
| ```console | ||||||
| docker run -p 9090:9090 -v $(pwd):/etc/prometheus --network="host" prom/prometheus | ||||||
| ``` | ||||||
|
|
||||||
| ### View results in Prometheus | ||||||
|
|
||||||
| To use the graphical interface for viewing our metrics with Prometheus, navigate | ||||||
| to [http://localhost:9090/graph](http://localhost:9090/graph), | ||||||
| and type `prometheus_metric_example_bucket` in the expression bar of the UI; | ||||||
| finally, click the execute button. | ||||||
|
|
||||||
| We should be able to see the following chart from the browser: | ||||||
|
|
||||||
| 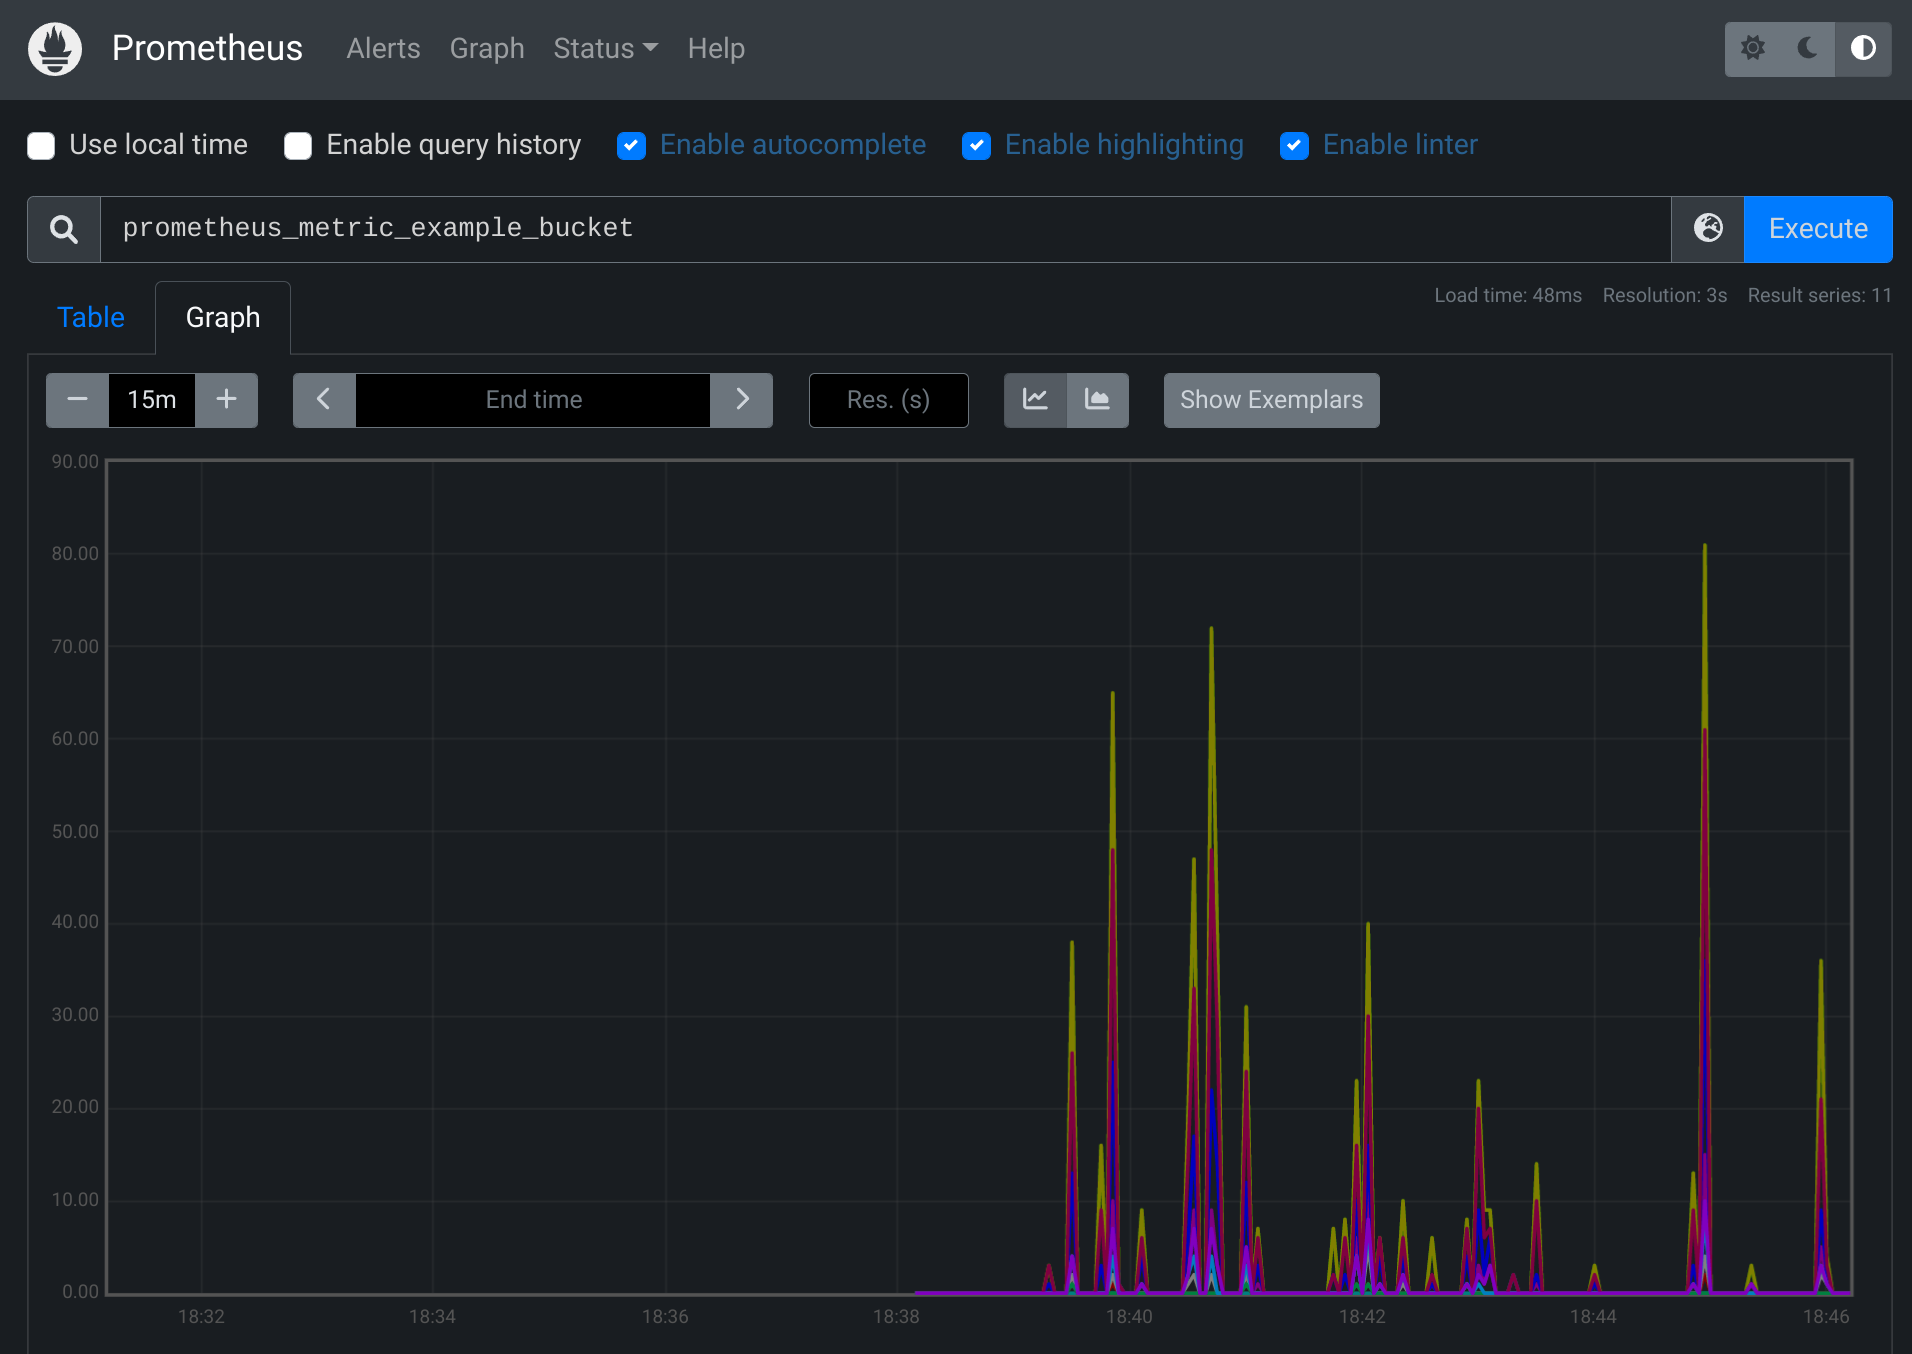 | ||||||
|
|
||||||
| From the legend, we can see that the `instance` name and the `job` name are the | ||||||
| values we have set in `prometheus.yml`. | ||||||
|
|
||||||
| Congratulations! | ||||||
|
|
||||||
| Now we know how to configure Prometheus server and deploy OpenTelemetry | ||||||
| `PrometheusExporter` to export our metrics. Next, we are going to explore a tool | ||||||
| called Grafana, which has powerful visualizations for the metrics. | ||||||
|
|
||||||
| ## Explore metrics using Grafana | ||||||
|
|
||||||
| [Install Grafana](https://grafana.com/docs/grafana/latest/installation/). | ||||||
|
|
||||||
| Start the standalone Grafana server (`grafana-server.exe` or | ||||||
| `./bin/grafana-server`, depending on the operating system). Then, use the | ||||||
| browser to navigate to [http://localhost:3000/](http://localhost:3000/). | ||||||
|
|
||||||
| ```sh | ||||||
| docker run -d -p 3000:3000 --network="host" grafana/grafana | ||||||
| ``` | ||||||
|
|
||||||
| Follow the instructions in the Grafana getting started | ||||||
| [doc](https://grafana.com/docs/grafana/latest/getting-started/getting-started/#step-2-log-in) | ||||||
| to log in. | ||||||
|
|
||||||
| After successfully logging in, click on the Configuration icon | ||||||
| on the panel at the left hand side, and click on Prometheus. | ||||||
| Type in the default endpoint of Prometheus as suggested by the UI | ||||||
| as the value for the URI. | ||||||
|
|
||||||
| ```console | ||||||
| http://localhost:9090 | ||||||
| ``` | ||||||
|
|
||||||
| Then, click on the Explore icon on the left panel of | ||||||
| the website - we should be able to write some queries to explore our metrics | ||||||
| now! | ||||||
|
|
||||||
| Feel free to find some handy PromQL | ||||||
| [here](https://promlabs.com/promql-cheat-sheet/). | ||||||
|
|
||||||
| 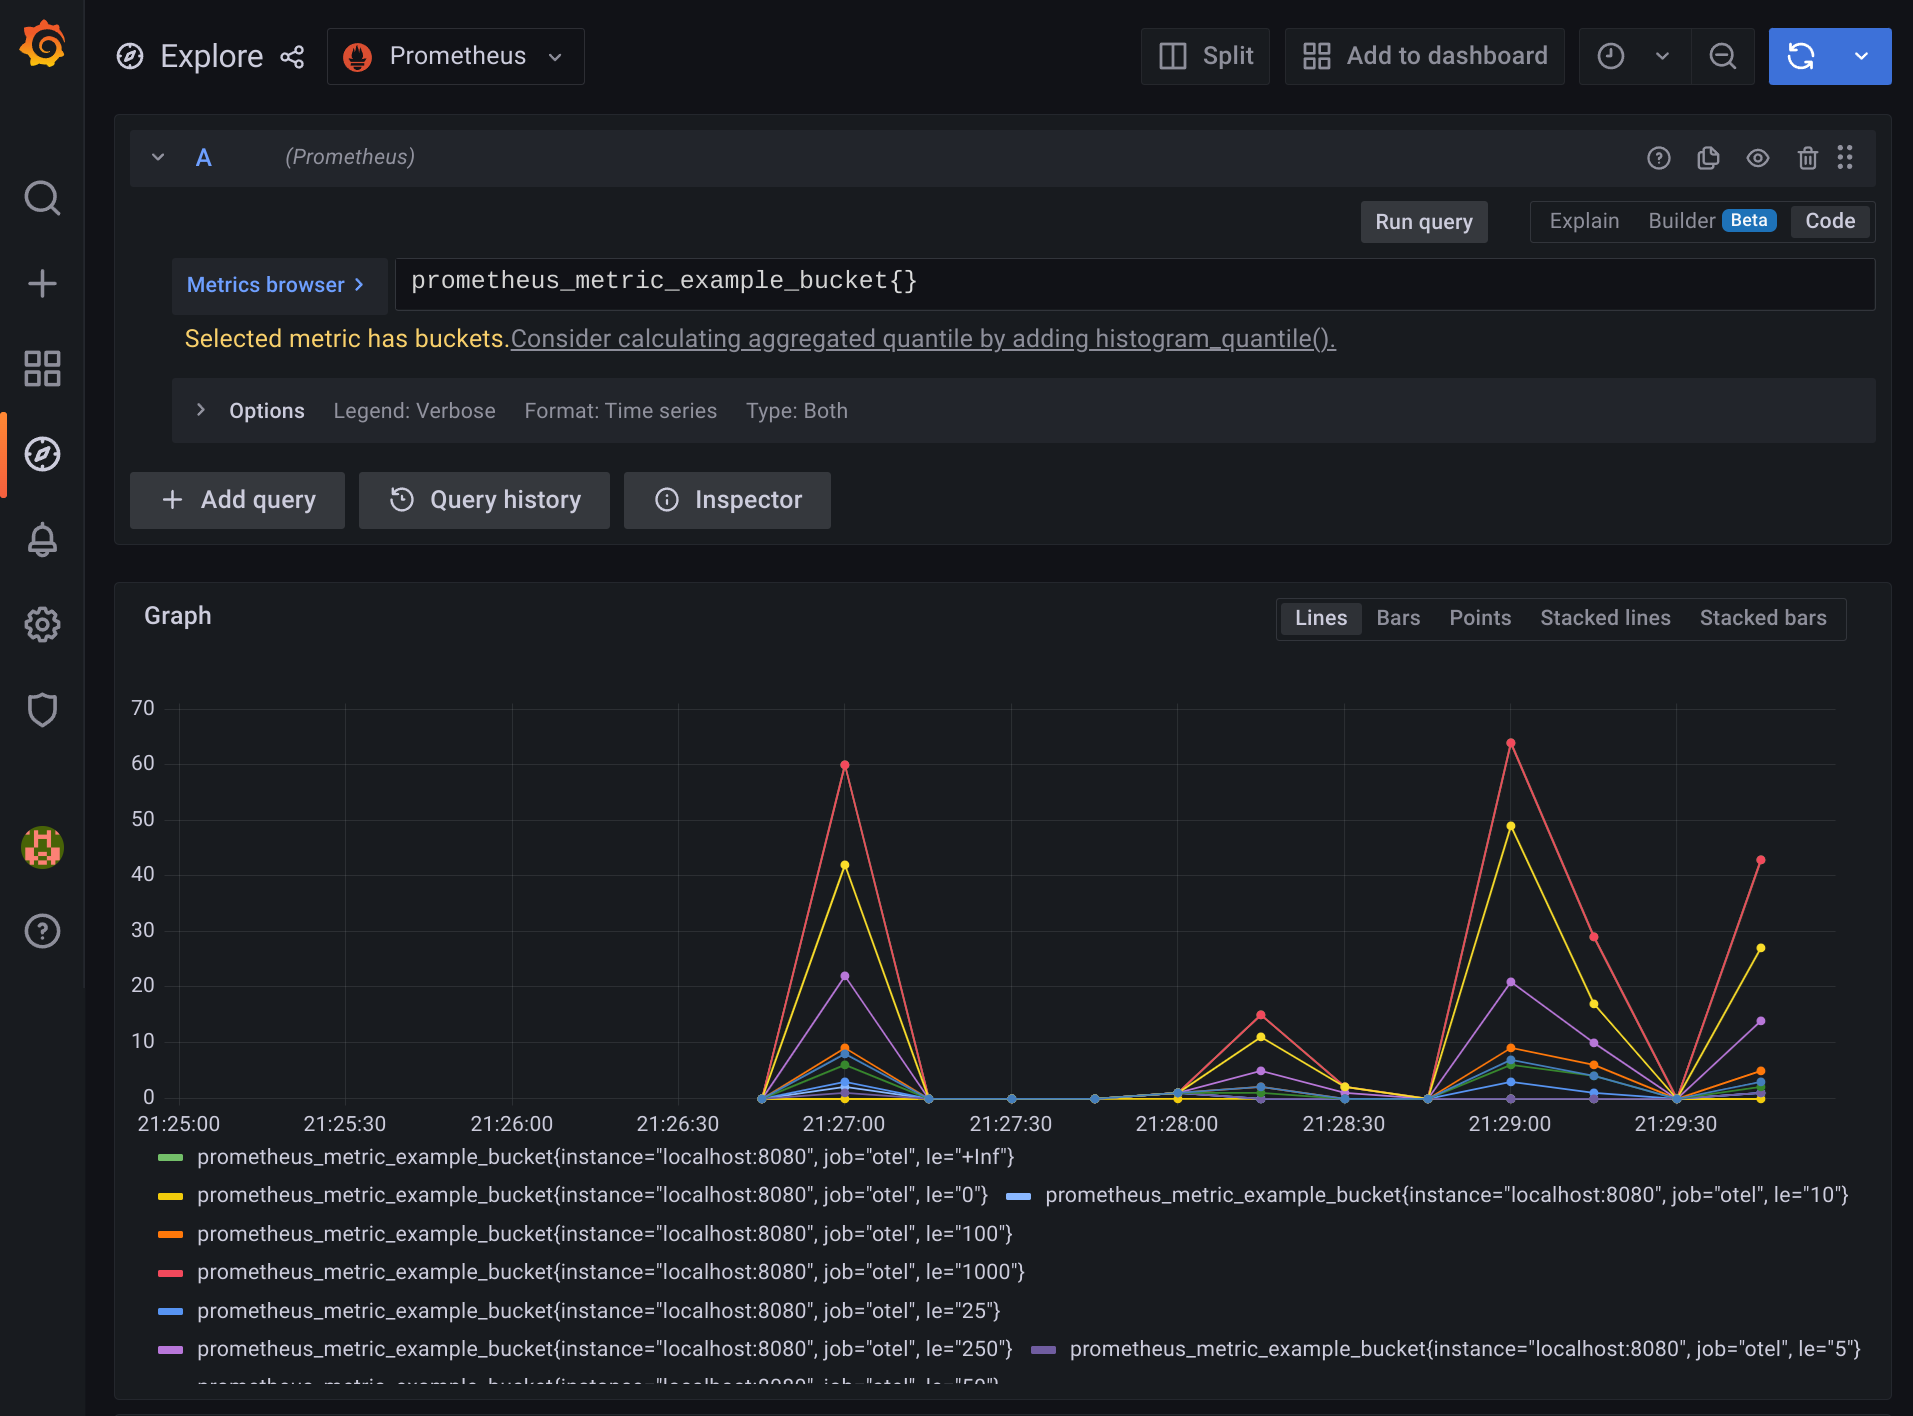 | ||||||
|
|
||||||
| ```mermaid | ||||||
| graph TD | ||||||
|
|
||||||
| subgraph Prometheus | ||||||
| PrometheusScraper | ||||||
| PrometheusDatabase | ||||||
| end | ||||||
|
|
||||||
| PrometheusExporter["PrometheusExporter<br/>(listening at #quot;http://localhost:8080/#quot;)"] -->|HTTP GET| PrometheusScraper{{"Prometheus scraper<br/>(polling #quot;http://localhost:8080/metrics#quot; every 10 seconds)"}} | ||||||
|
There was a problem hiding this comment.
Suggested change
|
||||||
| PrometheusScraper --> PrometheusDatabase[("Prometheus TSDB (time series database)")] | ||||||
| PrometheusDatabase -->|http://localhost:9090/graph| PrometheusUI["Browser<br/>(Prometheus Dashboard)"] | ||||||
| PrometheusDatabase -->|http://localhost:9090/api/| Grafana[Grafana Server] | ||||||
| Grafana -->|http://localhost:3000/dashboard| GrafanaUI["Browser<br/>(Grafana Dashboard)"] | ||||||
| ``` | ||||||
|
|
||||||
| ## Learn more | ||||||
|
|
||||||
| - [What is Prometheus?](https://prometheus.io/docs/introduction/overview/) | ||||||
| - [Grafana support for | ||||||
| Prometheus](https://prometheus.io/docs/visualization/grafana/#creating-a-prometheus-graph) | ||||||
Add this suggestion to a batch that can be applied as a single commit.
This suggestion is invalid because no changes were made to the code.
Suggestions cannot be applied while the pull request is closed.
Suggestions cannot be applied while viewing a subset of changes.
Only one suggestion per line can be applied in a batch.
Add this suggestion to a batch that can be applied as a single commit.
Applying suggestions on deleted lines is not supported.
You must change the existing code in this line in order to create a valid suggestion.
Outdated suggestions cannot be applied.
This suggestion has been applied or marked resolved.
Suggestions cannot be applied from pending reviews.
Suggestions cannot be applied on multi-line comments.
Suggestions cannot be applied while the pull request is queued to merge.
Suggestion cannot be applied right now. Please check back later.
There was a problem hiding this comment.
Choose a reason for hiding this comment
The reason will be displayed to describe this comment to others. Learn more.
Should we be making these changes in the example before running it?There was a problem hiding this comment.
Choose a reason for hiding this comment
The reason will be displayed to describe this comment to others. Learn more.
Sorry if I am missing something. Why do we need to modify ostream-metrics to export to Prometheus Exporter - the above step of running prometheus_example should already do the metrics export?
There was a problem hiding this comment.
Choose a reason for hiding this comment
The reason will be displayed to describe this comment to others. Learn more.
thanks, it is not needed to do anything extra here. I changed the wording to make it clear.