-
Notifications
You must be signed in to change notification settings - Fork 2.5k
New issue
Have a question about this project? Sign up for a free GitHub account to open an issue and contact its maintainers and the community.
By clicking “Sign up for GitHub”, you agree to our terms of service and privacy statement. We’ll occasionally send you account related emails.
Already on GitHub? Sign in to your account
[connector/spanmetrics] Delta span metric StartTimeUnixNano doesn't follow specification, causing unbounded memory usage with prometheusexporter #31671
Comments
|
Pinging code owners:
See Adding Labels via Comments if you do not have permissions to add labels yourself. |
|
I think we should change the behavior of the connector, but to be clear: having start timestamp equal the point timestamp is valid per the spec:
|
|
Looks like it's agreed that this is a bug, and a PR is welcome. I'll remove |
…mestamps representing an uninterrupted series. This can avoid significant memory usage compared to producing cumulative span metrics, as long a downstream component can convert from delta back to cumulative, which can depend on the timestamps being uninterrupted.
|
This issue has been inactive for 60 days. It will be closed in 60 days if there is no activity. To ping code owners by adding a component label, see Adding Labels via Comments, or if you are unsure of which component this issue relates to, please ping Pinging code owners:
See Adding Labels via Comments if you do not have permissions to add labels yourself. |
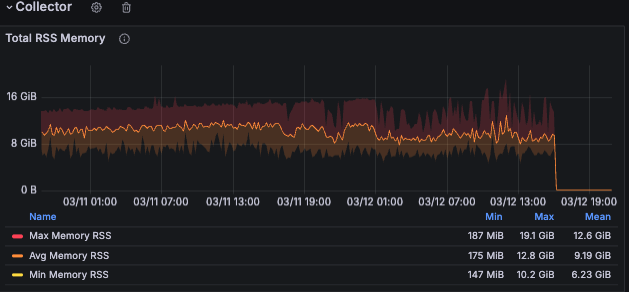
…imestamps representing an uninterrupted series (#31780) Closes #31671 **Description:** Currently delta temporality span metrics are produced with (StartTimestamp, Timestamp)'s of `(T1, T2), (T3, T4) ...`. However, the [specification](https://opentelemetry.io/docs/specs/otel/metrics/data-model/#temporality) says that the correct pattern for an uninterrupted delta series is `(T1, T2), (T2, T3) ...` This misalignment with the spec can confuse downstream components' conversion from delta temporality to cumulative temporality, causing each data point to be viewed as a cumulative counter "reset". An example of this is in `prometheusexporter` The conversion issue forces you to generate cumulative span metrics, which use significantly more memory to cache the cumulative counts. At work, I applied this patch to our collectors and switched to producing delta temporality metrics for `prometheusexporter` to then convert to cumulative. That caused a significant drop in-memory usage:  **Testing:** - Unit tests asserting the timestamps - Manual testing with `prometheusexporter` to make sure counter values are cumulative and no longer being reset after receiving each delta data point

Component(s)
connector/spanmetrics
What happened?
Expected Behaviour
The specification on metric temporality expects uninterrupted series of delta data points to have timestamps like below:
Actual Behaviour
When configuring
spanmetricsconnctorto use delta temporarily, the timestamps of successive data points follow the pattern(T1, T1), (T2, T2), (T3, T3). Basically theStartTimeUnixNanoandTimeUnixNanoare always set to the current timestamp.When configured to use cumulative temporality, the connector caches
StartTimeUnixNanoso that it can be used in the next data point. However, when using delta temporality that cache (resourceMetrics) gets wiped after each round of exporting metrics:opentelemetry-collector-contrib/connector/spanmetricsconnector/connector.go
Lines 283 to 301 in 71e6c55
Collector version
v0.94.0
Environment information
Testing done locally on mac OS
OpenTelemetry Collector configuration
Log output
No response
Additional context
Why fix this?
This could be a different way of fixing #30688 and #30559. It could also significantly reduce memory usage when combining
spanmetricsconnectorwith exporters likeprometheusexporter.I'm currently seeing high memory use in the collectors at my work with this set-up
Issue with Prometheus Exporter
prometheusexportersupports conversion from delta to cumulative temporality. However, it only works if the series follows the specification:opentelemetry-collector-contrib/exporter/prometheusexporter/accumulator.go
Lines 203 to 212 in 71e6c55
I think the author's rationale in the above code is that the delta series seems reset based on this part of the spec. So with the current delta span metric behaviour, prometheus views each data point as if the counter was reset.
A workaround is having the connector produce cumulative span metrics, but that requires the connector caching all series in memory, which is redundant since
prometheusexporteralready does this. @matej-g is working on an improvement to expire infrequently updated series from the cache which will definitely help with reducing memory.Solution Discussion
Having delta span metrics follow the spec could significantly reduce memory usage when used with
prometheusexporter.To do this, the connector probably has to cache the
StartTimeUnixNanofor each series when in delta mode. The memory used to cache the tunestamps should be much less than whatresourceMetricscaches though. That cache's values are nested structs holding data like metric attributes and histogram bucket sizesThe text was updated successfully, but these errors were encountered: