Gene gain/loss is considered to be one of the most important evolutionary processes
driving adaptive evolution, but it remains largely unexplored.
Therefore, to investigate the relationship between gene gain/loss and adaptive evolution
in the evolutionary process of organisms, I developed a software pipeline FastDTLmapper
which automatically estimates and maps genome-wide gene gain/loss.
FastDTLmapper takes two inputs, 1. Species tree (Newick format) & 2. Genomic Protein CDSs (Fasta|Genbank format),
and performs genome-wide mapping of DTL(Duplication-Transfer-Loss) events by
DTL reconciliation of species tree and gene trees.
Additionally, FastDTLmapper can perform
Plot Gain/Loss Map Figure and
Functional Analysis (GOEA)
using packaged subtools.

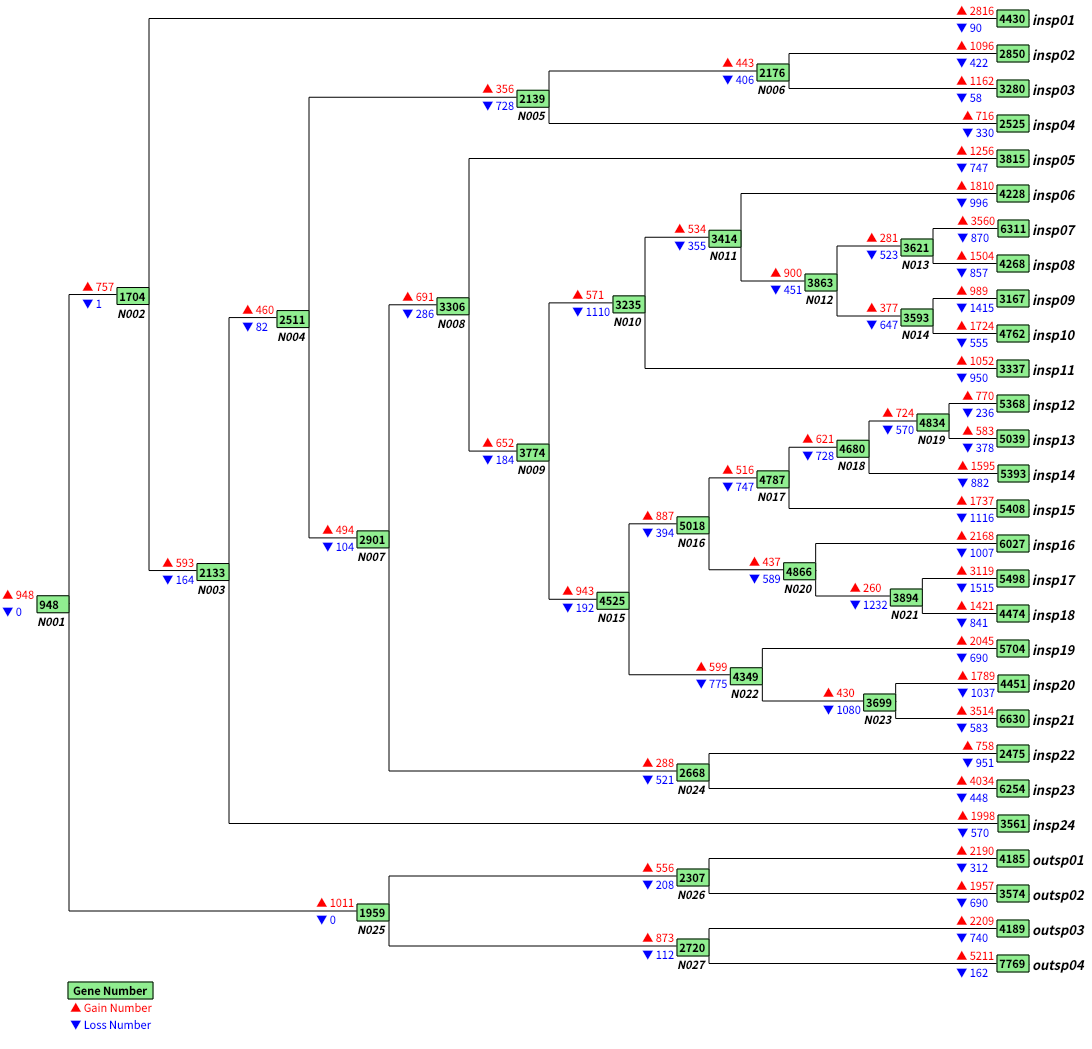
Fig. Genome-wide gain/loss map result example (all_gain_loss_map.nwk)
Each node gain/loss data is mapped in following format (NodeID | GeneNum [gain=GainNum los=LossNum])
Map data is embeded in newick format bootstrap value field and user can visualize using SeaView.
FastDTLmapper is implemented in Python3(>=3.7) and runs on Linux (Tested on Ubuntu20.04).
⚠️ Additionally, dependent tools require Python2.7 and Perl5. Since FastDTLmapper's dependencies are complex, it is recommended to use Docker image.
Install PyPI stable package:
pip install fastdtlmapper
Install latest development package:
pip install git+git://github.com/moshi4/FastDTLmapper.git
Use Docker (Image Registry):
docker pull ghcr.io/moshi4/fastdtlmapper:latest
docker run -it --rm ghcr.io/moshi4/fastdtlmapper:latest FastDTLmapper -h
Python package dependencies list here (auto installed with pip).
Well known python package numpy, pandas, scipy and
- BioPython
Utility tools for computational molecular biology - GOAtools
GOEA(GO Enrichment Analysis) tool - ETE3
Tree analysis and visualization tool
Following dependencies are packaged in src/fastdtlmapper/bin directory.
- OrthoFinder [v2.5.2]
Orthology inference tool - mafft [v7.487]
Sequences alignment tool - trimal [v1.4]
Alignment sequences trim tool - IQ-TREE [v2.1.3]
Phylogenetic tree reconstruction tool - Treerecs [v1.2]
Multifurcated gene tree correction tool - AnGST
DTL reconciliation tool (Requires Python 2.7 to run) - parallel [v20200922]
Job parallelization tool (Requires Perl5 to run)
Dependencies Citation List
BioPython:
Cock, P.J.A. et al.
Biopython: freely available Python tools for computational molecular biology and bioinformatics. (2009)
Bioinformatics 25(11) 1422-3
GOAtools:
Klopfenstein DV, Zhang L, Pedersen BS, ... Tang H
GOATOOLS: A Python library for Gene Ontologyy analyses (2018)
Scientific reports 8:10872
ETE:
Huerta-Cepas J., Serra F. and Bork P.
ETE 3: Reconstruction, analysis and visualization of phylogenomic data (2016)
Mol Biol Evol 33(6) 1635-1638
OrthoFinder:
Emms D.M. & Kelly S.
OrthoFinder: phylogenetic orthology inference for comparative genomics (2019)
Genome Biology 20:238
MAFFT:
Yamada, Tomii, Katoh.
Application of the MAFFT sequence alignment program to large data—reexamination of the usefulness of chained guide trees. (2016)
Bioinformatics 32:3246-3251
trimAl:
Salvador Capella-Gutierrez; Jose M. Silla-Martinez; Toni Gabaldon.
trimAl: a tool for automated alignment trimming in large-scale phylogenetic analyses. (2009)
Bioinformatics 25: 1972-1973.
IQ-TREE:
B.Q. Minh, H.A. Schmidt, O. Chernomor, D. Schrempf, M.D. Woodhams, A. von Haeseler, R. Lanfear.
IQ-TREE 2: New models and efficient methods for phylogenetic inference in the genomic era. (2020)
Mol. Biol. Evol. 37:1530-1534.
Treerecs:
Comte N, Morel B, Hasic D, Guéguen L, Boussau B, Daubin V, Penel S, Scornavacca C, Gouy M, Stamatakis A, et al.
Treerecs: an integrated phylogenetic tool, from sequences to reconciliations (2020)
Bioinformatics 36:4822–4824
AnGST:
Lawrence A David and Eric J Alm.
Rapid evolutionary innovation during an Archaean genetic expansion. (2010)
Nature. 469(7328):93-6
parallel:
O. Tange
GNU Parallel - The Command-Line Power Tool, ;login: (2011)
The USENIX Magazine, February 2011:42-47.
This is brief description of analysis pipeline. See wiki for details.
- Grouping ortholog sequences using OrthoFinder
- Align each OG(Ortholog Group) sequences using mafft
- Trim each OG alignment using trimal
- Reconstruct each OG gene tree using IQ-TREE
- Correct each OG gene tree multifurcation using Treerecs
- DTL reconciliation of species tree & each OG gene tree using AnGST
- Aggregate and map genome-wide DTL reconciliation result
FastDTLmapper -i [fasta|genbank directory] -t [species tree file] -o [output directory]
-i IN, --indir IN     Input Fasta(*.fa|*.faa|*.fasta), Genbank(*.gb|*.gbk|*.gbff) directory
-t TREE, --tree TREE  Input rooted species newick tree file
-o OUT, --outdir OUT  Output directory
-p , --process_num    Number of processor (Default: MaxProcessor - 1)
--dup_cost            Duplication event cost (Default: 2)
--los_cost            Loss event cost (Default: 1)
--trn_cost            Transfer event cost (Default: 3)
--inflation           OrthoFinder MCL inflation parameter (Default: 3.0)
--timetree            Use species tree as timetree in AnGST (Default: off)
--rseed               Number of random seed (Default: 0)
-v, --version         Print version information
-h, --help            Show this help message and exit
-
Timetree Option
If user set this option, input species tree must be ultrametric tree.
--timetree enable AnGST timetree option below (See AnGST manual for details).If the branch lengths on the provided species tree represent times, AnGST can restrict the set of possible inferred gene transfers to only those between contemporaneous lineages
-
Input Limitation
fasta or genbank files (--indir option)
⚠️ Following characters cannot be included in file name '_', '-', '|', '.', '$'species tree file (--tree option)
⚠️ Species name in species tree must match fasta or genbank file name
Click here to download dataset (5.8Mb).
This dataset is identical to example in this repository.
-
Minimum test dataset
7 species, 100 CDS limited fasta dataset
FastDTLmapper -i example/minimum_dataset/fasta/ -t example/minimum_dataset/species_tree.nwk -o output_minimum -
Mycoplasma dataset (Input Format = Fasta)
7 Mycoplasma species, 500 ~ 1000 CDS fasta dataset
FastDTLmapper -i example/mycoplasma_dataset/fasta/ -t example/mycoplasma_dataset/species_tree.nwk -o output_mycoplasma_fasta -
Mycoplasma dataset (Input Format = Genbank)
7 Mycoplasma species, 500 ~ 1000 CDS genbank dataset
FastDTLmapper -i example/mycoplasma_dataset/genbank/ -t example/mycoplasma_dataset/species_tree.nwk -o output_mycoplasma_genbank
| Top directory | Contents |
|---|---|
| 00_user_data | Formatted user input fasta and tree files |
| 01_orthofinder | OrthoFinder raw output results |
| 02_dtl_reconciliation | Each OG(Ortholog Group) DTL reconciliation result |
| 03_aggregate_map_result | Genome-wide DTL reconciliation aggregated and mapped results |
| log | Config log and command log files |
.
├── 00_user_data/  -- User input data
│   ├── fasta/     -- Formatted fasta files
│   └── tree/      -- Formatted newick species tree files
│
├── 01_orthofinder/  -- OrthoFinder raw output results
│
├── 02_dtl_reconciliation/  -- Each OG(Ortholog Group) DTL reconciliation result
│   ├── OG0000000/
│   │   ├── OG0000000.fa                 -- OG fasta file
│   │   ├── OG0000000_aln.fa             -- OG alignment fasta file
│   │   ├── OG0000000_aln_trim.fa        -- Trimmed OG alignement fasta file
│   │   ├── OG0000000_dtl_map.nwk        -- OG DTL event mapped tree file
│   │   ├── OG0000000_gain_loss_map.nwk  -- OG Gain-Loss event mapped tree file
│   │   ├── iqtree/                      -- IQ-TREE gene tree reconstruction result
│   │   ├── treerecs/                    -- Treerecs multifurcated gene tree correction result
│   │   └── angst/                       -- AnGST DTL reconciliation result
│   │
│   ├── OG0000001/
│   .
│   .
│   └── OGXXXXXXX/
│
├── 03_aggregate_map_result/  -- Genome-wide DTL reconciliation aggregated and mapped results
│   ├── all_dtl_map.nwk              -- Genome-wide DTL event mapped tree file
│   ├── all_gain_loss_map.nwk        -- Genome-wide Gain-Loss event mapped tree file
│   ├── all_og_node_event.tsv        -- All OG DTL event record file
│   ├── all_transfer_gene_count.tsv  -- All transfer gene count file
│   └── all_transfer_gene_list.tsv   -- All transfer gene list file
│
└── log/
    ├── parallel_cmds/ -- Parallel run command log results
    └── run_config.log -- Program run config log file
See wiki for output files details.
FastDTLmapper subtool plot_gain_loss_map supports for plotting
publication-ready gain/loss map figure as shown below.
User can plot easily and can output in any format user want by
changing plotting parameter.
See wiki for details.

Fig. Gain/Loss map plot result example
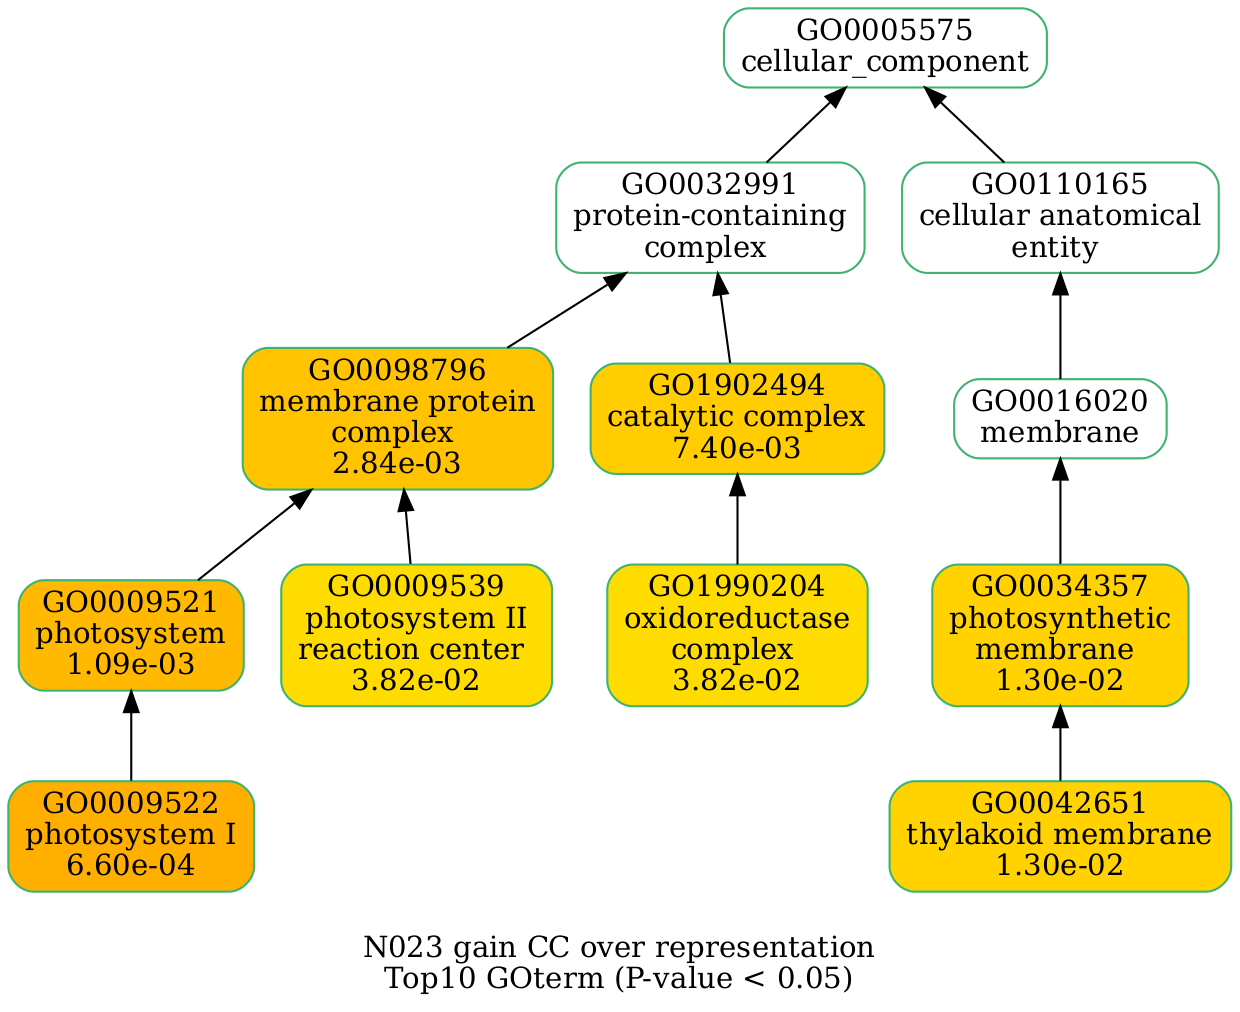
FastDTLmapper subtool FastDTLgoea supports for performing
GOEA(GO Enrichment Analysis) in each node gain/loss genes.
Each node gain/loss gene's significant GOterms are
listed and plotted as shown below.
This GOEA functional analysis is useful for getting glasp of genome-wide
functional trends in gain/loss genes. See wiki for details.

Fig. GOEA plot result example
In this example, gain gene's significant over representation
GOterms in N023 node is plotted with color.
CC indicates GO category of 'Cell Components'. 3 GO category BP,MF,CC exists.


