Home
链接:https://pan.baidu.com/s/1BgJdkjPXUL8MAVmTNM-5tg 提取码:axxw
This function read your bigwig files and return a data.frame format:
library(tackPlotR)
library(ggsci)
library(rtracklayer)

# 1.load gtf
gtf <- import.gff('Mus_musculus.GRCm38.102.gtf',format = 'gtf') %>%
  data.frame()

# help
?loadBWfile

file <- c(
  "control.input.bw", "control.ip.bw",
  "t1.input.bw", "t1.ip.bw",
  "t2.input.bw", "t2.ip.bw"
)
samp <- c(
  "control.input", "control.ip",
  "t1.input", "t1.ip",
  "t2.input", "t2.ip"
)
group1 <- c(rep(c("Input", "IP"), 3))
group2 <- c(rep("Control", 2), rep("T1", 2), rep("T2", 2))

# 2.load bw files
allBw <- loadBWfile(file = file, sample = samp, group1 = group1, group2 = group2)

# check
head(allBw,3)

#   seqnames   start     end   score        sample group1  group2
# 1        1       1 3001485  0.0000 control.input  Input Control
# 2        1 3001486 3001490 12.5599 control.input  Input Control
# 3 1 3001491 3001510 25.1199 control.input Input ControlThis function read your bigwig files to plot track with gene structure:
defult plot:
# examples
plotTrack(
  gtfFile = gtf,
  gene = "Actb",
  arrowCol = "black",
  bigwigFile = allBw,
  sampleAes = "group1",
  facetVars = "sample"
)
change aes variable:
# change aes variable
plotTrack(
  gtfFile = gtf,
  gene = "Actb",
  arrowCol = "black",
  bigwigFile = allBw,
  sampleAes = "sample",
  facetVars = "sample"
)
change track colors:
# change track colors
plotTrack(
  gtfFile = gtf,
  gene = "Actb",
  arrowCol = "black",
  bigwigFile = allBw,
  sampleAes = "sample",
  facetVars = "sample",
  trackCol = pal_lancet()(6)
)
draw multiple genes:
# draw multiple genes
plotTrack(
  gtfFile = gtf,
  gene = "Tnf",
  arrowCol = "black",
  bigwigFile = allBw,
  sampleAes = "group1",
  facetVars = "sample",
  multiple = TRUE,
  myTransId = c("ENSMUST00000025263", "ENSMUST00000167924")
)
change facet fill colors:
# change facet fill colors
plotTrack(
  gtfFile = gtf,
  gene = "Actb",
  arrowCol = "black",
  bigwigFile = allBw,
  sampleAes = "group1",
  addfacetCol = TRUE,
  facetVars = "sample",
  facetFill = pal_d3()(6),
  borderCol = rep("white", 6)
)
add one facet:
# add one facet
plotTrack(
  gtfFile = gtf,
  gene = "Actb",
  arrowCol = "black",
  bigwigFile = allBw,
  sampleAes = "group1",
  facetVars = c("group2", "group1"),
  addfacetCol = TRUE,
  facetFill = c(pal_d3()(3), pal_npg()(6)),
  borderCol = rep("white", 9)
)
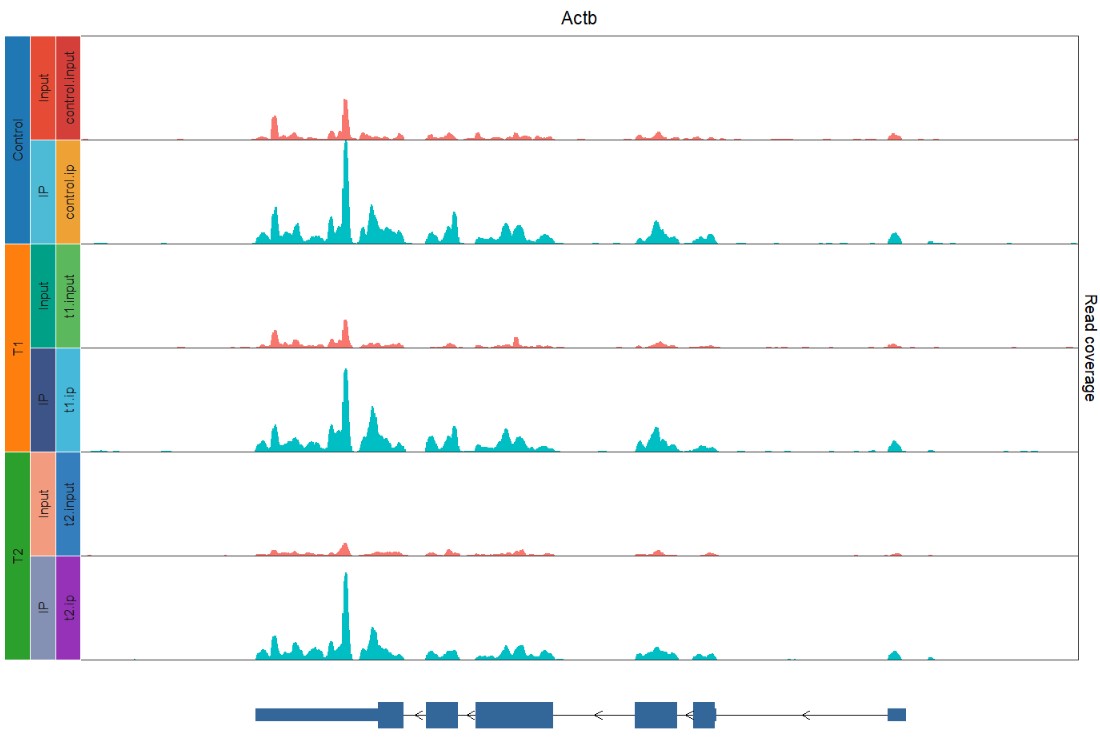
add more one facet:
# add more one facet
plotTrack(
  gtfFile = gtf,
  gene = "Actb",
  arrowCol = "black",
  bigwigFile = allBw,
  sampleAes = "group1",
  facetVars = c("group2", "group1", "sample"),
  addfacetCol = TRUE,
  facetFill = c(pal_d3()(3), pal_npg()(6), pal_locuszoom()(6)),
  borderCol = rep("white", 15)
)