The aim of this project is to create an generated user interface (GUI) using Python's Tkinter module to generate random arrays of data values in the form of a bargraph and implement sorting algorithms such as Bubble Sort, Insertion Sort, Quick Sort and Merge Sort to sort the data values and show an animation of how the array is sorted at each step.
In preparation for my techincal interviews when applying for jobs, I decided to make a project that demonstrates what I've learned from studying for these interviews. So I made this project and in the process of making this I've came to a deeper understanding of these sorting alogrithms.
When it came to creating the GUI, I had to first configure the background and size of the window using the Tkinter module. The white canvas background would be where the bargraph would be generated while the gray box above would be where the user can manipulate certain variables to their liking. The user can change the sorting algorithm, the sorting speed of the algorithm (ranging from 0.1 to 5.0 seconds), the array size (ranging from 3 to 100), the min value (ranging from 0 to 10), and the max value (ranging from 10 to 100). There is a button to generate a new random array based off of the variables mentioned beofre that the user can change and obviously there is also a button to start the sorting algorithm. For more details on the creation of GUI, refer to the comments in the sortingAlgorithmVisualizer.py file.
I'm going to assume that you know how the sorting algorithms work but if not then refer to these links to understand: Bubble Sort , Quick Sort , Merge Sort , and Insertion Sort. That aside, when it came to coding out how the sorting would be animated on the GUI the easier of the four would be the Bubble Sort and Insertion Sort probably due to their time complexity of O(n2) making them not so efficient in sorting in comparsion to Quick Sort's and Merge Sort's time complexity of O(n log n). Coding out Quick Sort's and Merge Sort's animations were more difficult as both algorithms are Divide and Conquer algorithm where the array is recursively broken down into smaller parts and solved with the base case. I also had to use different colors on certains to denote a variable on each iteration which I will go over in the next section. Once again for more details, refer to the comments in each of the sorting algorithm py files.
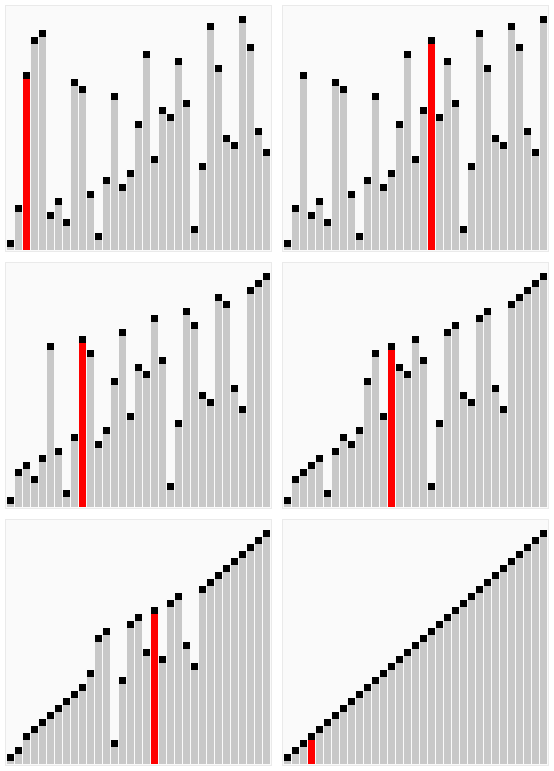
So for the Bubble Sort algorithm, this is how the algorithm is expected to go about sorting an array:


In my animation, once a random array of data values is generated it is always denoted as red meaning the data values are unsorted. When two arrays are highlighted in purple that meant to denote that the values are about to be swapped and once the sorting is comeplete all the bars in the graph are colored in blue.

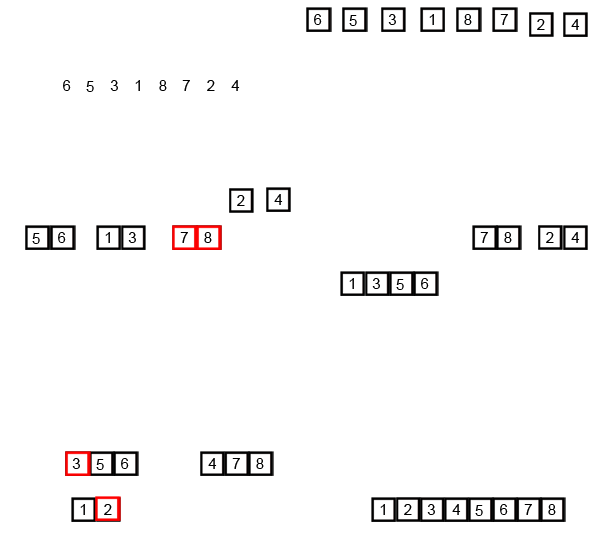
Next is the Quick Sort which is expected to sort an array as the following:


In my animation, the color orange is used denoted the pivot while the color green is used denoted the border. The bars in gray represent the current range of elements the algorithm is looking at while yellow is the current element being looked at in the iteration. As usual, purple represents elements that are about to be swapped and all bars are blue as the sort is completed.

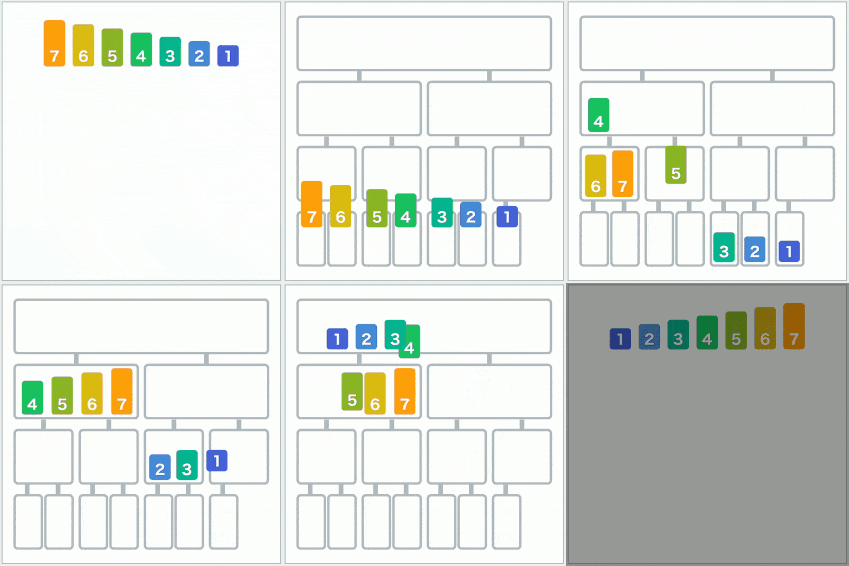
Merge Sort sorts the array as the following way:


In my version of the Merge Sort animation, orange represents the left half of the array while green represents the right half of the array. The remaining colors have the same meaning as prevoiusly mentioned above.

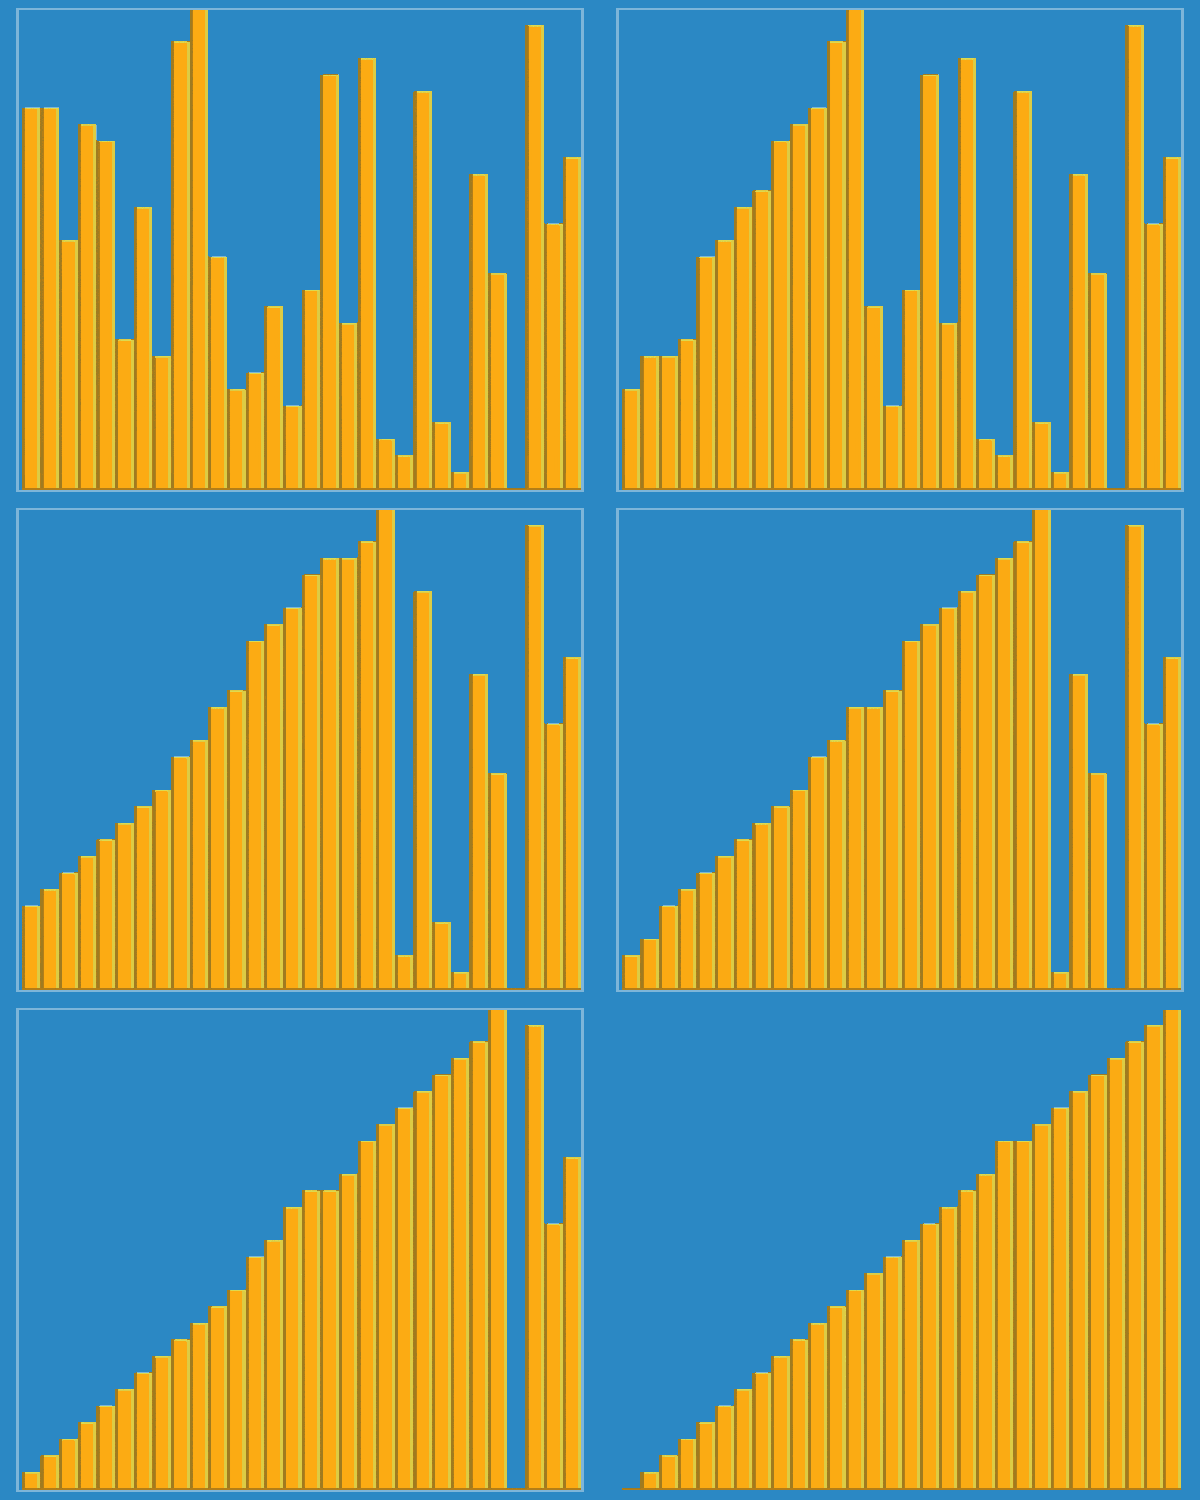
Lastly the Insertion sort algorithm operates on the array doing the following steps:


The color representation in my Insertion Sort animation is exactly the same as the Bubble Sort.

As much as I like Python's Tkinter module, I think this project would look way better if it was done as React Application. However I'm not knowledgeable in React at the moment so I resort to using Python; this is why it took me so long to complete this project. There are limits to how many data values, and how high the values can be and I feel that React could help in solving this issue. I could also implement more sorting alogrithms such as Heap Sort, and Selection Sort in the future.