[Security Solution] Security Alert Table Performance Optimizations #192827
Conversation
|
Pinging @elastic/security-threat-hunting-investigations (Team:Threat Hunting:Investigations) |
| @@ -741,6 +746,7 @@ const AlertsTable: React.FunctionComponent<AlertsTableProps> = memo((props: Aler | |||
| ref={dataGridRef} | |||
| renderCustomGridBody={dynamicRowHeight ? renderCustomGridBody : undefined} | |||
There was a problem hiding this comment.
@elastic/response-ops team, do we know why dynamicRowHeight triggers renderCustomGridBody. Dynamic height can simply be achieved by passing rowHeight: auto in rowHeightUtils as mentioned here: https://eui.elastic.co/#/tabular-content/data-grid-style-display#row-heights-options
There was a problem hiding this comment.
Okay I just found this PR : #169257 but i am not sure why / how customRenderGridBody will improve the re-renders. Eui's auto height works perfectly as shown in above benchmarks. Please let me know if I am missing something.
There was a problem hiding this comment.
Hey! Let's wait for @umbopepato input (he is on PTO). He is the most knowledgeable person regarding this.
...ity_solution/public/timelines/components/timeline/body/renderers/combine_renderers/index.tsx
Show resolved
Hide resolved
|
@logeekal I haven't looked at the code yet, but testing locally I feel like this is a introducing an annoying UI behavior. As you can see in the video below (on Screen.Recording.2024-09-17.at.10.59.04.AM.movOn this branch though, changing the number of items per page doesn't change the height of the table, but just introduces virtualization within the table. Yes it is much faster going to the 50 or 100 items per page, but the UI feels really clunky. It takes too much time to load, and the fact that we're limited with the height of the space available seems really annoying to me. Also going to a smaller number of items gets us in a weird state where the height does not adjust. Screen.Recording.2024-09-17.at.10.54.46.AM.movIs that the expected behavior? |
I understand what you mean but I think we need to limit the height of table somewhere ( we can decide where that limit lies) and not expand table to its full height, specially alert table. This is because the performance of
But clunky do you mean, gray area coming before rows are loaded when you scroll down? It is same way records are loaded in discover & timeline.
I have set the limit to 10. If the number of records are less than 10, the table will auto adjust according to number of records. I have tagged you on the configuration. Do you have any suggestions there? |
| // if records are too less, we don't want table to be of fixed height. | ||
| // it should shrink to the content height. | ||
| // Height setting enables/disables virtualization depending on fixed/undefined height values respectively. | ||
| height: count >= 10 ? `${DEFAULT_DATA_GRID_HEIGHT}px` : undefined, |
There was a problem hiding this comment.
@PhilippeOberti , this controls how auto vs max height of the table is managed. I have below suggestion. Do you think below could work. We can also increase the height as below :
const DEFAULT_DATA_GRID_HEIGHT = "1000"| height: count >= 10 ? `${DEFAULT_DATA_GRID_HEIGHT}px` : undefined, | |
| height: count >= 25 ? `${DEFAULT_DATA_GRID_HEIGHT}px` : undefined, |
There was a problem hiding this comment.
hey @logeekal I'm so sorry to get back on you so late. I understand a bit more now, thanks for the explanation!
I think I found what's bothering me the most:
In our current setup, the pagination is at the very bottom of the table, right below the last item, even when the table renders less items that the number of items per page.
In the new system, there will very frequently be a white gap between the items in the table and the pagination, which looks really odd.
Discover - while having a similar behavior - is looking much better (to my subjective eyes) because their pagination is fixed at the bottom of the pate (always visible and not impacted by the user scrolling).
I understand that doing is exactly like Discover might be more challenging, and would be out of scope for this PR anyway as it's not really performance optimization but more look and feel...
I did run some tests for different resolution (focusing on the height of the window only). I tried to see what could be the table height to have the pagination at the very bottom of the page, right above the timeline banner at the very bottom.
Here are the numbers that I found:
| Resolution (height only) | Table height - KPI collapsed | Table height - KPI expanded |
|---|---|---|
| 1080px | 610px | 300px |
| 1200px | 730px | 420px |
| 1440px | 970px | 660px |
I'm not sure what to do here... We definitely don't want to handle KPI collapsed vs expanded, and I don't think it's really worth handling different screen sizes...
I'm not sure what to do at this time 😆
There was a problem hiding this comment.
Hey @PhilippeOberti , thanks for your analysis and feedback. I like it. I have added the changes we discussed in our meeting.
There was a problem hiding this comment.
thanks @logeekal! To summarize the discussion here:
- we're displaying a default height of 600px which works on most of the screens
- on 4K screens the table isn't taking the entire height available and we might in the future increase the 600px, but as this a less likely scenario to happen we can revisit this later.
- when the item count is lower than 20, the table height switches to automatic mode to avoid having empty space between the table items and the pagination
- now that we have virtualization, we can increase the default number of items per page. The decision is to go from 20 to 50 (Discover has a default of 100)
|
Hey @logeekal! As you have noticed as well, we hardly ever make use of the EuiDataGrid virtualization (either because alerts tables are rarely explicitly sized or because the number of rows is fairly limited). Considered this, and to address a performance issue caused by the unused virtualization layer that caused a complete rerender of the whole table each time a row was rendered, we decided to provide an option to disable virtualization. This reduced the number of renders and seemed to provide a pretty good tradeoff in terms of performance when using the event rendered view (see #169257). |
Thanks @umbopepato for your feedback. There have been some optimizations from outside because of which renders have drastically reduced and |
|
hey @umbopepato , Could you please review this PR to see if it needs any more changes from trigger actions perspective. |
|
@elasticmachine merge upstream |
|
There are no new commits on the base branch. |
|
Starting backport for target branches: 8.x https://github.com/elastic/kibana/actions/runs/11294200932 |
💛 Build succeeded, but was flaky
Failed CI StepsTest FailuresMetrics [docs]Async chunks
History
|
…lastic#192827) ## Summary There are few performance issues with Security's alert table today which this PR aims to fix. 1. Virtualization was not working in Grid View and Event Rendered View. Constraining the height of `EuiDataGrid` makes virtualization work. 2. It was taking lot of time when switching between Event Rendered View and Grid view. Below we compare some performance metric in both above scenarios. ## Solution - Solution was to enable virtualization but bounding the height of the table. - If number of rows < 10, then height is `auto` else it maxed at `600px` ## Grid View - 100 Rows - Changing Query If you compare times below for rendering of Alert Table Components, we see that improvement is of 2.5-5 times. Number of re-renders are also fewer. ### Before 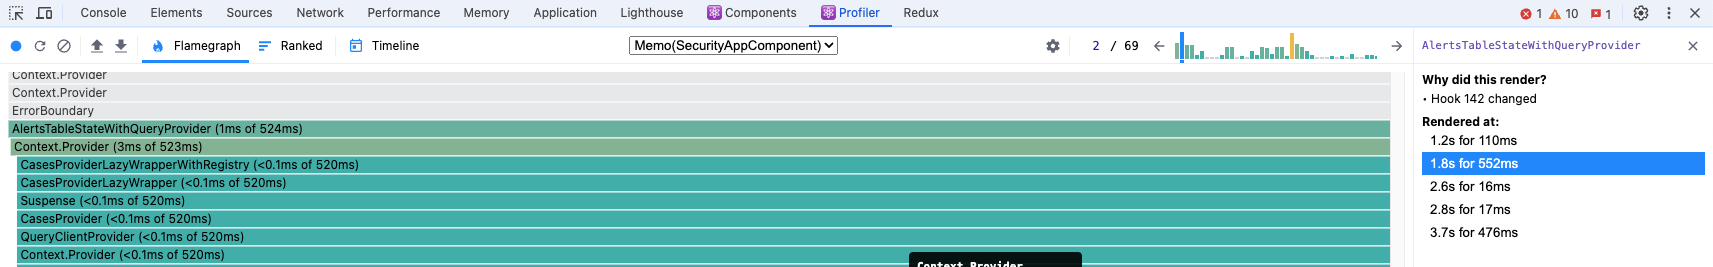 ### After 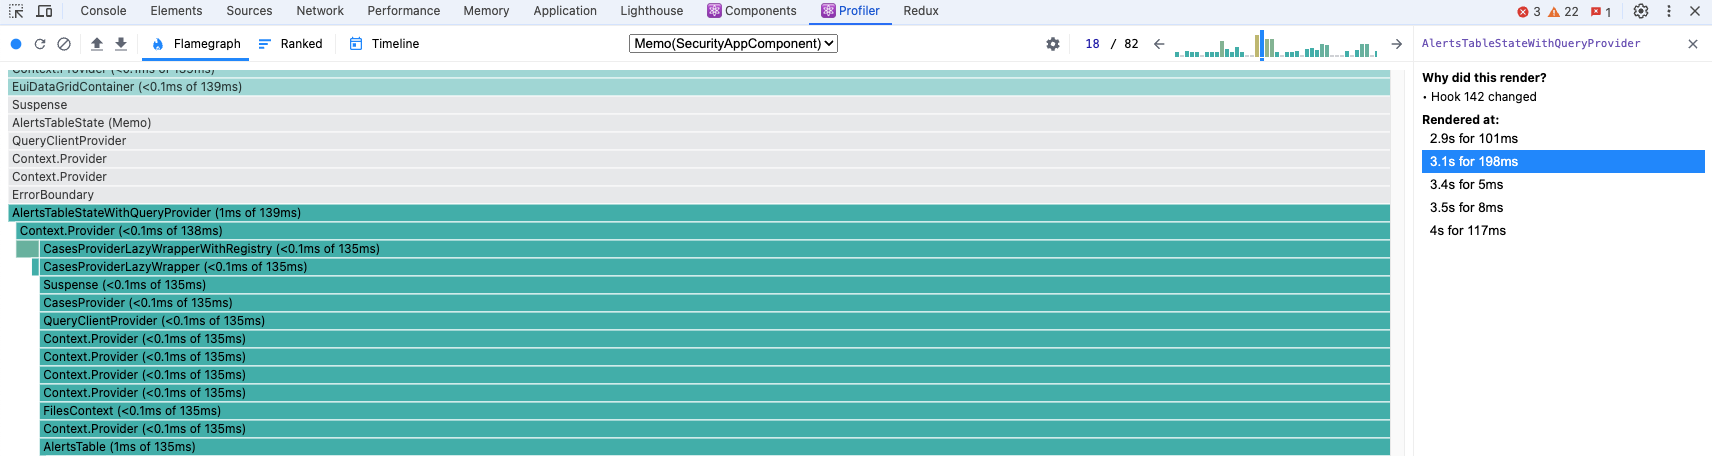 ## Grid View - 100 Rows - Changing view to Event Rendered View Event Rendered View is where these optimization actually shine. If you observe the rendering times, performance gain is upto 10 times for all renders. Number of re-renders are also reduced. ### Before 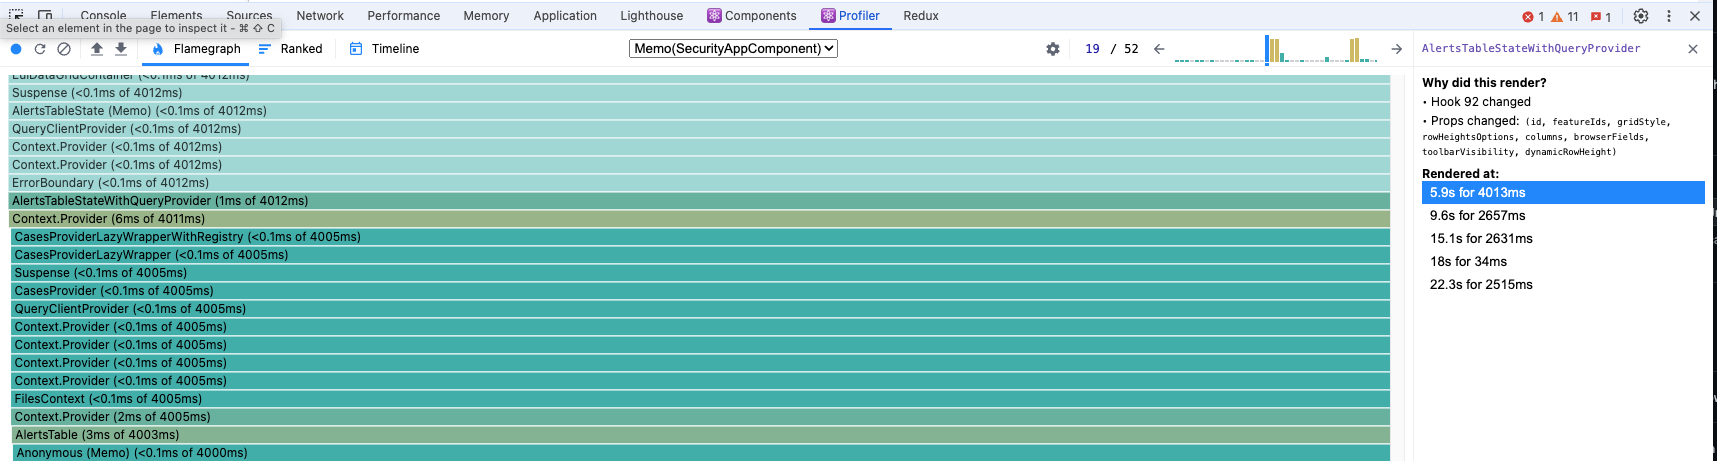 ### After 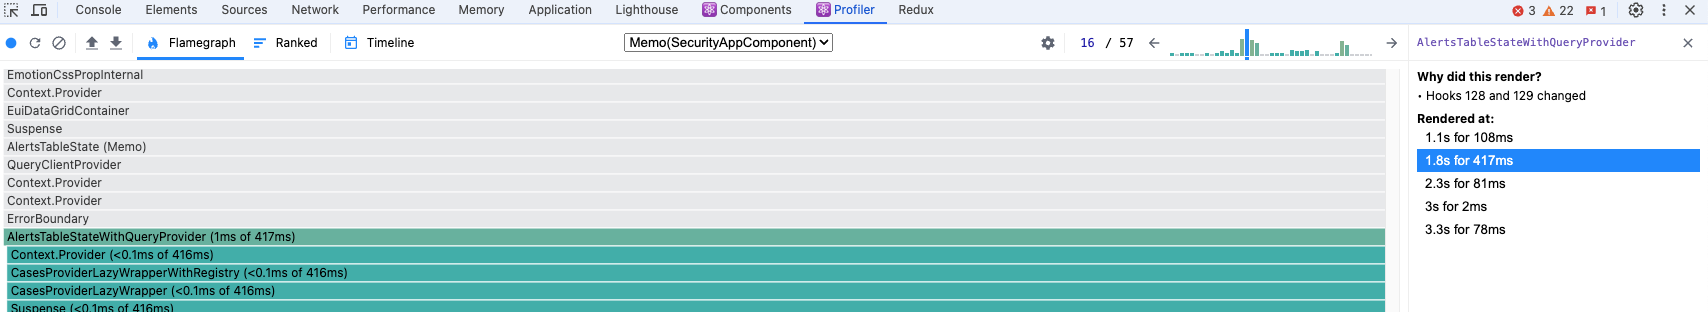 ## Grid View - Change page size from 20 rows to 100 rows Here also we achieve almost 15 times improvement in the render times of the table. ### Before 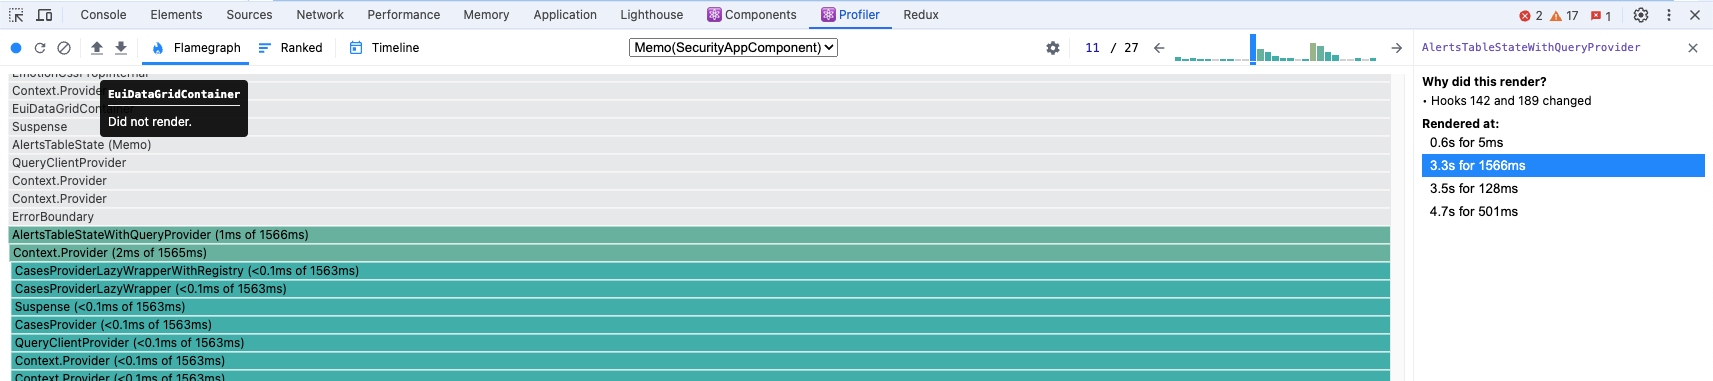 ### After 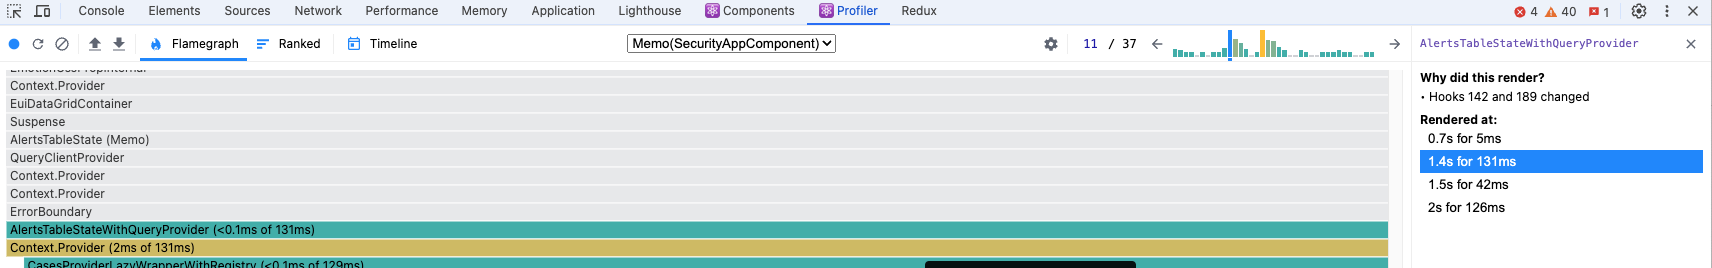 ## Desk Testing Guide Below scenarios need to tested to make sure Alert Table is working fine in both Grid View and Event Rendered View 1. Alert Page - Analyzer is working fine - Session Viewer is working fine - Alert Table when grouping is enabled. 3. Rule Details Page - Analyzer is working fine - Session Viewer is working fine - Alert Table when grouping is enabled. 5. Full Screen. - Analyzer is working fine - Session Viewer is working fine 7. Number of records < 10 - should resize the table to fit the content. 8. Number of records > 10 - should have fixed height and no-virtualization enabled. 9. Change view from Event Rendered View 10. Increase rows from default of `20` to `100` (cherry picked from commit a84d62d)
💚 All backports created successfully
Note: Successful backport PRs will be merged automatically after passing CI. Questions ?Please refer to the Backport tool documentation |

…ons (#192827) (#195935) # Backport This will backport the following commits from `main` to `8.x`: - [[Security Solution] Security Alert Table Performance Optimizations (#192827)](#192827) <!--- Backport version: 9.4.3 --> ### Questions ? Please refer to the [Backport tool documentation](https://github.com/sqren/backport) <!--BACKPORT [{"author":{"name":"Jatin Kathuria","email":"jatin.kathuria@elastic.co"},"sourceCommit":{"committedDate":"2024-10-11T14:29:58Z","message":"[Security Solution] Security Alert Table Performance Optimizations (#192827)\n\n## Summary\r\n\r\nThere are few performance issues with Security's alert table today which\r\nthis PR aims to fix.\r\n\r\n1. Virtualization was not working in Grid View and Event Rendered View.\r\nConstraining the height of `EuiDataGrid` makes virtualization work.\r\n2. It was taking lot of time when switching between Event Rendered View\r\nand Grid view.\r\n\r\nBelow we compare some performance metric in both above scenarios.\r\n\r\n## Solution\r\n\r\n- Solution was to enable virtualization but bounding the height of the\r\ntable.\r\n- If number of rows < 10, then height is `auto` else it maxed at `600px`\r\n\r\n## Grid View - 100 Rows - Changing Query\r\n\r\nIf you compare times below for rendering of Alert Table Components, we\r\nsee that improvement is of 2.5-5 times.\r\n\r\nNumber of re-renders are also fewer.\r\n\r\n### Before\r\n\r\n\r\n\r\n\r\n\r\n### After\r\n\r\n\r\n\r\n\r\n\r\n## Grid View - 100 Rows - Changing view to Event Rendered View\r\n\r\nEvent Rendered View is where these optimization actually shine. If you\r\nobserve the rendering times, performance gain is upto 10 times for all\r\nrenders. Number of re-renders are also reduced.\r\n\r\n### Before\r\n\r\n\r\n\r\n\r\n### After\r\n\r\n\r\n\r\n\r\n## Grid View - Change page size from 20 rows to 100 rows\r\n\r\nHere also we achieve almost 15 times improvement in the render times of\r\nthe table.\r\n\r\n### Before\r\n\r\n\r\n\r\n \r\n### After\r\n\r\n\r\n\r\n\r\n## Desk Testing Guide\r\n\r\nBelow scenarios need to tested to make sure Alert Table is working fine\r\nin both Grid View and Event Rendered View\r\n\r\n1. Alert Page\r\n - Analyzer is working fine\r\n - Session Viewer is working fine\r\n - Alert Table when grouping is enabled.\r\n3. Rule Details Page\r\n - Analyzer is working fine\r\n - Session Viewer is working fine\r\n - Alert Table when grouping is enabled.\r\n5. Full Screen.\r\n - Analyzer is working fine\r\n - Session Viewer is working fine\r\n7. Number of records < 10\r\n - should resize the table to fit the content.\r\n8. Number of records > 10\r\n - should have fixed height and no-virtualization enabled.\r\n9. Change view from Event Rendered View\r\n10. Increase rows from default of `20` to `100`","sha":"a84d62dce6f386ef114ef25a99d2b7e0c56719c2","branchLabelMapping":{"^v9.0.0$":"main","^v8.16.0$":"8.x","^v(\\d+).(\\d+).\\d+$":"$1.$2"}},"sourcePullRequest":{"labels":["release_note:fix","v9.0.0","Team:Threat Hunting:Investigations","backport:prev-minor"],"title":"[Security Solution] Security Alert Table Performance Optimizations","number":192827,"url":"https://github.com/elastic/kibana/pull/192827","mergeCommit":{"message":"[Security Solution] Security Alert Table Performance Optimizations (#192827)\n\n## Summary\r\n\r\nThere are few performance issues with Security's alert table today which\r\nthis PR aims to fix.\r\n\r\n1. Virtualization was not working in Grid View and Event Rendered View.\r\nConstraining the height of `EuiDataGrid` makes virtualization work.\r\n2. It was taking lot of time when switching between Event Rendered View\r\nand Grid view.\r\n\r\nBelow we compare some performance metric in both above scenarios.\r\n\r\n## Solution\r\n\r\n- Solution was to enable virtualization but bounding the height of the\r\ntable.\r\n- If number of rows < 10, then height is `auto` else it maxed at `600px`\r\n\r\n## Grid View - 100 Rows - Changing Query\r\n\r\nIf you compare times below for rendering of Alert Table Components, we\r\nsee that improvement is of 2.5-5 times.\r\n\r\nNumber of re-renders are also fewer.\r\n\r\n### Before\r\n\r\n\r\n\r\n\r\n\r\n### After\r\n\r\n\r\n\r\n\r\n\r\n## Grid View - 100 Rows - Changing view to Event Rendered View\r\n\r\nEvent Rendered View is where these optimization actually shine. If you\r\nobserve the rendering times, performance gain is upto 10 times for all\r\nrenders. Number of re-renders are also reduced.\r\n\r\n### Before\r\n\r\n\r\n\r\n\r\n### After\r\n\r\n\r\n\r\n\r\n## Grid View - Change page size from 20 rows to 100 rows\r\n\r\nHere also we achieve almost 15 times improvement in the render times of\r\nthe table.\r\n\r\n### Before\r\n\r\n\r\n\r\n \r\n### After\r\n\r\n\r\n\r\n\r\n## Desk Testing Guide\r\n\r\nBelow scenarios need to tested to make sure Alert Table is working fine\r\nin both Grid View and Event Rendered View\r\n\r\n1. Alert Page\r\n - Analyzer is working fine\r\n - Session Viewer is working fine\r\n - Alert Table when grouping is enabled.\r\n3. Rule Details Page\r\n - Analyzer is working fine\r\n - Session Viewer is working fine\r\n - Alert Table when grouping is enabled.\r\n5. Full Screen.\r\n - Analyzer is working fine\r\n - Session Viewer is working fine\r\n7. Number of records < 10\r\n - should resize the table to fit the content.\r\n8. Number of records > 10\r\n - should have fixed height and no-virtualization enabled.\r\n9. Change view from Event Rendered View\r\n10. Increase rows from default of `20` to `100`","sha":"a84d62dce6f386ef114ef25a99d2b7e0c56719c2"}},"sourceBranch":"main","suggestedTargetBranches":[],"targetPullRequestStates":[{"branch":"main","label":"v9.0.0","branchLabelMappingKey":"^v9.0.0$","isSourceBranch":true,"state":"MERGED","url":"https://github.com/elastic/kibana/pull/192827","number":192827,"mergeCommit":{"message":"[Security Solution] Security Alert Table Performance Optimizations (#192827)\n\n## Summary\r\n\r\nThere are few performance issues with Security's alert table today which\r\nthis PR aims to fix.\r\n\r\n1. Virtualization was not working in Grid View and Event Rendered View.\r\nConstraining the height of `EuiDataGrid` makes virtualization work.\r\n2. It was taking lot of time when switching between Event Rendered View\r\nand Grid view.\r\n\r\nBelow we compare some performance metric in both above scenarios.\r\n\r\n## Solution\r\n\r\n- Solution was to enable virtualization but bounding the height of the\r\ntable.\r\n- If number of rows < 10, then height is `auto` else it maxed at `600px`\r\n\r\n## Grid View - 100 Rows - Changing Query\r\n\r\nIf you compare times below for rendering of Alert Table Components, we\r\nsee that improvement is of 2.5-5 times.\r\n\r\nNumber of re-renders are also fewer.\r\n\r\n### Before\r\n\r\n\r\n\r\n\r\n\r\n### After\r\n\r\n\r\n\r\n\r\n\r\n## Grid View - 100 Rows - Changing view to Event Rendered View\r\n\r\nEvent Rendered View is where these optimization actually shine. If you\r\nobserve the rendering times, performance gain is upto 10 times for all\r\nrenders. Number of re-renders are also reduced.\r\n\r\n### Before\r\n\r\n\r\n\r\n\r\n### After\r\n\r\n\r\n\r\n\r\n## Grid View - Change page size from 20 rows to 100 rows\r\n\r\nHere also we achieve almost 15 times improvement in the render times of\r\nthe table.\r\n\r\n### Before\r\n\r\n\r\n\r\n \r\n### After\r\n\r\n\r\n\r\n\r\n## Desk Testing Guide\r\n\r\nBelow scenarios need to tested to make sure Alert Table is working fine\r\nin both Grid View and Event Rendered View\r\n\r\n1. Alert Page\r\n - Analyzer is working fine\r\n - Session Viewer is working fine\r\n - Alert Table when grouping is enabled.\r\n3. Rule Details Page\r\n - Analyzer is working fine\r\n - Session Viewer is working fine\r\n - Alert Table when grouping is enabled.\r\n5. Full Screen.\r\n - Analyzer is working fine\r\n - Session Viewer is working fine\r\n7. Number of records < 10\r\n - should resize the table to fit the content.\r\n8. Number of records > 10\r\n - should have fixed height and no-virtualization enabled.\r\n9. Change view from Event Rendered View\r\n10. Increase rows from default of `20` to `100`","sha":"a84d62dce6f386ef114ef25a99d2b7e0c56719c2"}}]}] BACKPORT--> Co-authored-by: Jatin Kathuria <jatin.kathuria@elastic.co>
Summary
There are few performance issues with Security's alert table today which this PR aims to fix.
EuiDataGridmakes virtualization work.Below we compare some performance metric in both above scenarios.
Solution
autoelse it maxed at600pxGrid View - 100 Rows - Changing Query
If you compare times below for rendering of Alert Table Components, we see that improvement is of 2.5-5 times.
Number of re-renders are also fewer.
Before
After
Grid View - 100 Rows - Changing view to Event Rendered View
Event Rendered View is where these optimization actually shine. If you observe the rendering times, performance gain is upto 10 times for all renders. Number of re-renders are also reduced.
Before
After
Grid View - Change page size from 20 rows to 100 rows
Here also we achieve almost 15 times improvement in the render times of the table.
Before
After
Desk Testing Guide
Below scenarios need to tested to make sure Alert Table is working fine in both Grid View and Event Rendered View
20to100