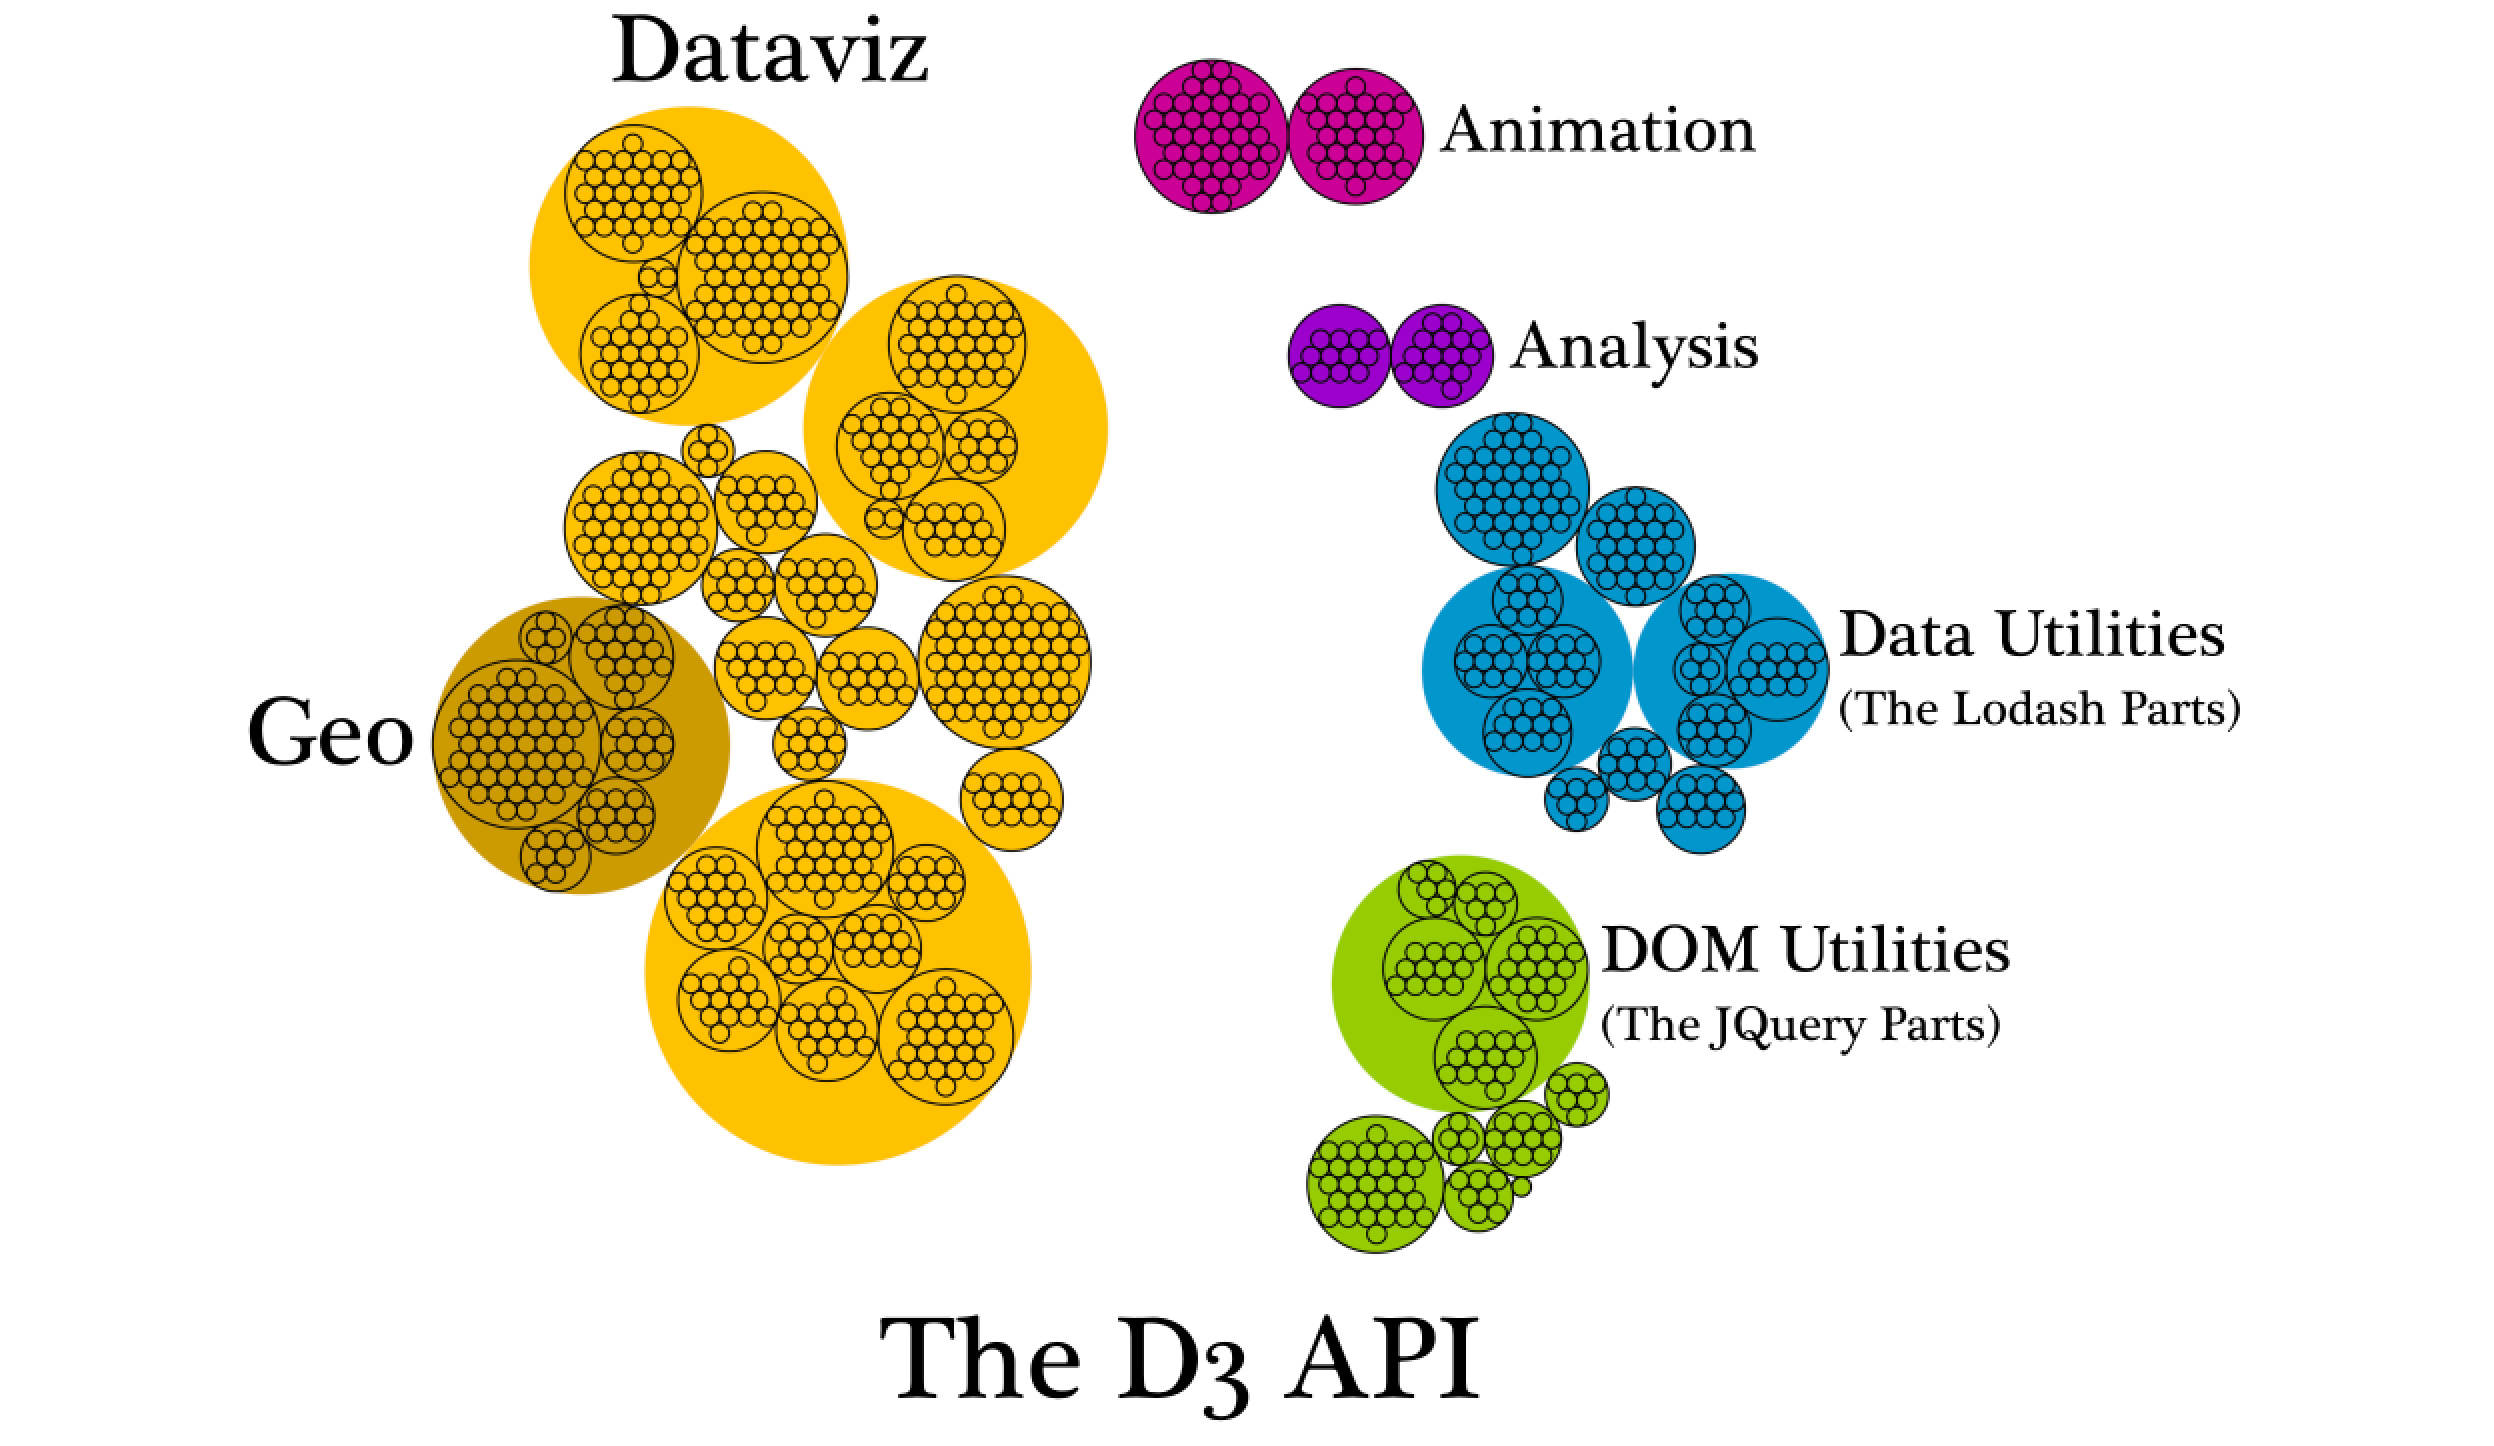
"Much of D3 has little to do with graphics and many of the parts that do aren’t necessary to learn to create effective data visualization"
https://medium.com/@Elijah_Meeks/d3-is-not-a-data-visualization-library-67ba549e8520
- Not the best and most current examples
- Can look intimidating
- API is huge, but documented well and modularized
- Almost all graph libraries (recharts, react-vis, ...) are depending on d3
- You definitely can
- Do your research
- API's might not be
- easily customizable
- easy to understand
- not typed?
- Might not have full control of your visualizations and/or data
- Just because D3 is needed, doesn't mean building out svg/canvas is necessary
- min/max/scale calculations
- Org Tree https://codesandbox.io/s/kind-archimedes-1romym
- Uses
stratifyD3 method to convert a flat data set to a tree.
- Uses
- Hill Chart https://codesandbox.io/s/keen-bouman-vs0odt
- https://wattenberger.com/blog/react-and-d3
- The Visual Display of Quantitative Information
npm install d3 d3-shape d3-scale d3-axis d3-selection ...