Add the new getting started content #10596
There are no files selected for viewing
| Original file line number | Diff line number | Diff line change |
|---|---|---|
| @@ -0,0 +1,70 @@ | ||
| --- | ||
| title: "Measuring activation: getting the most out of your PostHog integration" | ||
| nextPage: ./retention.mdx | ||
| --- | ||
|
|
||
| import { AnalyticsPlannerTip } from 'components/Docs/AnalyticsPlannerTip' | ||
| import { Admonition } from 'components/Docs/Admonition' | ||
|
|
||
| <AnalyticsPlannerTip /> | ||
|
|
||
| We've got the basics of our PostHog integration up and rolling. | ||
|
|
||
| Next we need to define and track the behavior that indicates a user is actually getting something from our product. | ||
|
|
||
| We call this **activation**: once someone passes this threshold, they're likely to keep coming back, building their skills and otherwise making progress with us. If someone *does not* pass this threshold, they still don't know why we're valuable. | ||
|
|
||
| Like our North Star, we want to think about activation as a precursor to revenue. What steps must someone take in our product to reach the point where they would be happy to pay for it, understanding the value it provides? | ||
|
|
||
| Just because someone has signed up or logged in doesn't mean they're *using* our tools. That's where measuring activation comes in. | ||
|
|
||
| Once we know how many people do or don't activate, we can adjust our product design to influence that number. | ||
|
|
||
| # Activation by example | ||
|
|
||
| Let's talk through a few cases of activation you might have seen yourself: | ||
|
|
||
| For **Dropbox**, activation was simple: a user who stored one file within the first week was likely to become a long-term customer. Seeing your files sync so seamlessly is persuasive, and likely sparks more ideas about how to use the product. If you never get there, you don't understand the value firsthand. | ||
|
|
||
| In **Uber's** case, activation was taking a first ride. Once you understand the simplicity of pushing a button and receiving transportation, you'll likely do it again. | ||
|
|
||
| Some products have wide variability in how they get used, like **Pinterest**. Rather than focus on a specific behavior, they counted activation according to the number of days within a month someone used the product. Anything more than four counted as activation. | ||
|
|
||
| Quantity is a totally reasonable factor in activation! For **PostHog's** session replay product, we count activation as anyone who has watched at least five replays. Just looking at one or two is more like kicking the tires. | ||
|
|
||
| Activation looks different for every product. It can be expressed as a quantity of events, or even as a composite of multiple events. | ||
|
|
||
| <Admonition icon="IconPencil" title="Activation planning"> | ||
|
|
||
| Let's think about activation for our product. What event or events correspond to seriously *getting* what we do and cementing why a customer would want to keep using us? | ||
|
|
||
| Which events tracked in PostHog correspond to activation? Do we need to track more? | ||
|
|
||
| </Admonition> | ||
|
|
||
| # Tracking activation | ||
|
|
||
| With the product emitting events we need to measure activation, we can create a new **insight** to provide ongoing measurement and reporting. | ||
|
|
||
| 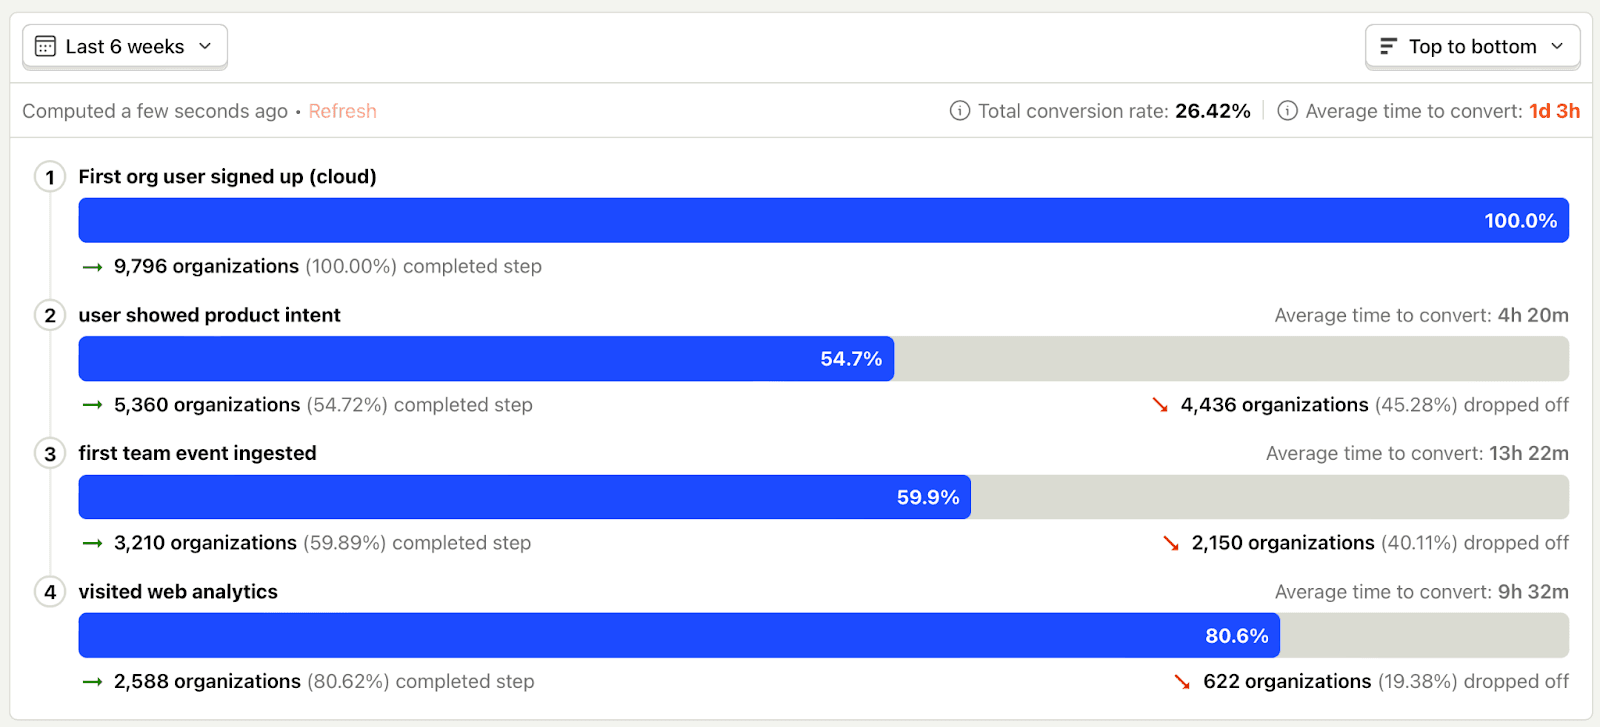 | ||
|
|
||
| One good way to start is to use a **funnel**. This will show you progression from the total population of users – people who have logged in, say – toward the events that represent your activation. You'll see the percentage of dropoff for each step, and this will give you something to chip away at with your product design. | ||
|
|
||
| Each step in a funnel can be finely constrained using filters, so you're measuring exactly the behavior that you described in the above worksheet. | ||
|
|
||
| Learn more: [Funnel documentation](/docs/product-analytics/funnels). | ||
|
|
||
| Once your funnel is created, add it to your project's [dashboard](/docs/product-analytics/dashboards). | ||
|
|
||
| ## Advanced activation tracking | ||
|
|
||
| A more complex activation sequence – where the intermediate steps could happen in any order – may need a custom query. This post [on how we found our activation metric](product-engineers/activation-metrics) walks through the thinking and queries behind this approach. | ||
|
|
||
| # Next steps | ||
|
|
||
| With event data ingesting reliably into PostHog, and a clear sense of your activation criteria now reporting for your team, it's time to think about **retention**: how many of your users *continue using your product.* | ||
|
|
||
| ## Additional reading | ||
|
|
||
| - [Ian's activation crash course newsletter] | ||
| - [Experiments](/experiments): test out product variations and measure the results |
|
There was a problem hiding this comment. Also, think about the goal of this: motivating people to install PostHog. It feels like we shove a lot of concepts that don't help us with this goal like talking about event naming. There was a problem hiding this comment.
Oh, interesting. No, the goal is not getting people to install PostHog. People install PostHog and get docs guidance for doing so by onboarding into the product and following the workflow with the little platform picker and snippet provider. The goal here is to get people to use their integration for the greatest possible leverage, and to have the shared mental model to not fuck it up. There was a problem hiding this comment. Could it be part of this section then? There was a problem hiding this comment.
I feel confident this content belongs in docs. Here's why: If the ceiling on our docs is model field tables, explanations of function calls, and rote instruction on which function to call to achieve a given outcome, that limits our impact.
So we get this right, we help multiply the impact of every person selling PostHog, we improve the likelihood that smaller teams who aren't yet working with sales get further, and everyone can know what to actually do for maximum impact after the snippet is installed. I got to ride shotgun while a PostHog integration went sideways. Brand new startup, tiny team, relatively simple communication structure. Smart guys. But they had zero model of things like activation (which they desperately needed to measure) and everything went more poorly for it. They just didn't understand what PostHog was for in their mission, nor did they know where to start to build their confidence in the path forward. And we had no artifacts that could weave this stuff together in a coherent, efficient way. I wasn't going to get a seed-stage CEO to read a dozen blog posts, you know? Related, I got this email the other day, following up on a docs-related gripe from a new user:
There was a problem hiding this comment. Adding some of my general thoughts to this thread: This does belong in docs imo, it's more a question of when and how. I think the first 'Getting HogPilled' page is a weird entry point for docs overall because it starts with lots of high-level concepts, rather than the product / platform itself. We could fix this in a couple of ways:
Fwiw, I think the answer may be to do both. Start with the install guides, but add a 'What is PostHog?' page before Getting HogPilled anyway. |
| Original file line number | Diff line number | Diff line change |
|---|---|---|
| @@ -0,0 +1,134 @@ | ||
| --- | ||
| title: "Getting HogPilled: how to win with PostHog" | ||
| nextPage: ./activation.mdx | ||
| --- | ||
|
|
||
| import { AnalyticsPlannerTip } from 'components/Docs/AnalyticsPlannerTip' | ||
| import { Admonition } from 'components/Docs/Admonition' | ||
|
|
||
| <AnalyticsPlannerTip /> | ||
|
|
||
| Most startups fail, and most startups that win do it by accident. | ||
|
|
||
| We can do better. | ||
|
|
||
| A strong approach to product analytics lets us **win on purpose**. We define success as a number we can measure, then describe the user behavior that feeds that number. | ||
|
There was a problem hiding this comment. Can success be boiled down to setting a specific metric and trying to optimize for it? I feel like this isn't true as a core principle. |
||
|
|
||
| This allows us to track if a product is meeting its business goals over time, and use that information to iterate into more impact for customers and profitability for ourselves. | ||
|
|
||
| Here's how. | ||
|
|
||
| # North Star metric | ||
|
|
||
| We start with a number that represents the health of our immediate goals. | ||
|
|
||
| It's not going to be revenue. | ||
|
|
||
| Instead, we want to count something that's a **precursor to revenue**. Something where, if it doesn't happen, we don't have a business. Examples from businesses you've heard of: | ||
|
|
||
| **Facebook**: Daily active users | ||
| **Airbnb**: Nights booked | ||
| **Uber**: Number of rides | ||
|
|
||
| See how easy it is to understand these numbers? A good North Star is measurable and easy to communicate. Everyone on the team, no matter their role, grasps their relationship to it. | ||
|
|
||
| If you're *super* early, you could start with a metric like signups: how many people care enough to try your product? | ||
|
|
||
| <Admonition icon="IconPencil" title="Plan your North Star"> | ||
|
|
||
| What does traction look like for your business? | ||
|
|
||
| Which metric corresponds to traction right now? Call that your **North Star metric**. | ||
| </Admonition> | ||
|
|
||
| # Defining our v0 metrics tree | ||
|
|
||
| With a North Star in mind, we can back out to the **user behavior** that feeds it. | ||
|
|
||
| <img height="700" alt="abstract-metrics-tree" src="https://res.cloudinary.com/dmukukwp6/image/upload/abstract_metrics_tree_c737164554.png" /> | ||
|
|
||
| **Events** are things that users do that we can track in code, and then measure across all usage of the product. | ||
|
|
||
| ## Example: ride sharing | ||
|
|
||
| Uber can't make money if no one launches the app. `app_launched`, then, becomes, an essential event for them keep track of. | ||
|
|
||
| But there's still no money until `ride_requested` happens. | ||
|
|
||
| Even that doesn't quite get us to a ride. We need a couple more: `ride_accepted` and `ride_began` | ||
|
|
||
| <img width="1688" alt="ride-sharing-metrics-tree" src="https://res.cloudinary.com/dmukukwp6/image/upload/ride_sharing_metrics_tree_a0a1560337.png" /> | ||
|
|
||
| It's these events *together* that give us a picture of how people use the product to get a ride. While counting only `ride_began` would give us enough to measure our North Star, it would *not* be enough to learn how to influence it. | ||
|
|
||
| ## Funnels | ||
|
|
||
| <img height="500" alt="ride-sharing-funnel" src="https://res.cloudinary.com/dmukukwp6/image/upload/ride_sharing_funnel_7e4f6b19eb.png" /> | ||
|
|
||
| Because events often happen in a predictable sequence, we can use that sequence to learn if users are getting stuck or bailing out. | ||
|
|
||
| This is called a **funnel**. | ||
|
|
||
| Funnels are simple: they measure successful progress between events. More people will launch the app than start a ride, but you still want to maximize the progress from one to the other. A funnel lets you understand how well that's going. | ||
|
|
||
| If there's a sharp drop between, say, accepting a ride and starting one, that could point to an issue that needs to be fixed in the product. | ||
|
|
||
| Funnels give us the information we need to diagnose problems and measure the impact of new solutions. We'll want to make sure we capture just enough event data to measure the critical path between starting in our product and succeeding with it. | ||
|
|
||
| <Admonition icon="IconPencil" title="Planning a metrics tree"> | ||
|
|
||
| Recap your traction goal and North Star metric, then think about the events that drive that metric. | ||
|
|
||
| These are the events that must be captured as part of integrating PostHog. | ||
|
|
||
| </Admonition> | ||
|
|
||
| # Integration planning | ||
|
|
||
| Now: | ||
|
|
||
| - We know what we're measuring | ||
| - We know why we're measuring it | ||
| - We know what events lead to the outcome we want | ||
|
|
||
| With these details in-hand, we can make a plan to capture the data we need. This data collection will help us understand how users interact with our product, and how well our product meets our goals. | ||
|
|
||
| <Admonition icon="IconWarning" title="Avoid event pitfalls" type="caution"> | ||
|
|
||
| Ideal event names are self-explanatory, avoiding strange abbreviations or codes. Don't stuff data into event names – they should be **comparable across all users** of your product. Instead, we want to tuck additional data into [properties](/docs/data/events#event-properties) *on* events. | ||
|
|
||
| </Admonition> | ||
|
|
||
| <Admonition icon="IconPencil" title="Planning user identification"> | ||
|
|
||
| What **unique identifier** should be used to identify users? Ideally, this is an ID from the database that won't change, but an email address can work too. | ||
|
|
||
| Where will `identify()` be called? Typically `identify()` is invoked in the client, but some architectures, like SSR web apps, will call it on the server. | ||
|
|
||
| </Admonition> | ||
|
|
||
| ## Integration references | ||
|
|
||
| For more detail on PostHog's data model, identifying users, and general integration guidance, check out our docs: | ||
|
|
||
| - [PostHog data model](/docs/how-posthog-works/data-model) | ||
| - [Identifying users](/docs/getting-started/identify-users) | ||
| - [Event tracking](/tutorials/event-tracking-guide) | ||
| - [SDKs](/docs/libraries) | ||
| - [Framework guides](/docs/frameworks) | ||
|
|
||
| ## Gotchas | ||
|
|
||
| Integration is straightforward, but things can get messier as time goes on. Here are a few things to watch out for. | ||
|
|
||
| ### Event naming | ||
|
|
||
| Pick a [naming convention](/docs/product-analytics/best-practices#3-implement-a-naming-convention) and stick with it\! There isn't a right choice here, only a wrong choice: different people on your team using different event names or conventions to describe the same behavior. | ||
|
|
||
| Be warned: PostHog's event storage is 'write only' for all practical purposes. You can't edit existing events, so it's important to design against naming drift. Otherwise, you may find queries much harder to work with down the road. | ||
|
|
||
| ### User identity | ||
|
|
||
| Complex authentication flows and tracking anonymous users from both client and server can complicate identifying users. | ||
|
|
||
| PostHog enforces some rules use of the identify function to prevent users from being merged incorrectly. Learn more about [Alias](/docs/product-analytics/identify#alias-assigning-multiple-distinct-ids-to-the-same-user) if you intend to provide more than one of your own IDs for a user, or you need to merge identities on the server. | ||
| Original file line number | Diff line number | Diff line change |
|---|---|---|
| @@ -0,0 +1,70 @@ | ||
| --- | ||
| title: "Users who come back: tracking retention with PostHog" | ||
| nextPage: ./revenue.mdx | ||
| --- | ||
|
|
||
| import { AnalyticsPlannerTip } from 'components/Docs/AnalyticsPlannerTip' | ||
| import { Admonition } from 'components/Docs/Admonition' | ||
|
|
||
| <AnalyticsPlannerTip /> | ||
|
|
||
| With integration complete and activation defined, we turn our sights toward measuring how well we keep our customers coming back. | ||
|
|
||
| This is **retention**. Much like activation, retention can vary from product to product. | ||
|
|
||
| Once more, we need to think about retention as a *precursor to revenue*. What kind of ongoing usage can we use to measure that people are happy with what they get from us, and will be just as happy to pay for it? | ||
|
|
||
| Activation is a good sign, but if someone doesn't use our product on an ongoing basis, that could be a problem. | ||
|
|
||
| The lower our product's retention, the more we have to keep acquiring new customers just to stay in the same place. | ||
|
|
||
| # Thinking about retention | ||
|
|
||
| A simple example for retention is a social product. If a user signs up and follows a bunch of people (activation), all of our effort is for nothing if they never come back. We'll have an empty room, no matter how many new rows are added to our users table. Returning within a few days, probably several times, would represent strong retention. | ||
|
|
||
| Actions that show up in our activation metric could also pull double-duty in a retention metric. In the **Uber** example, taking one ride is activation, while taking three rides in a month would demonstrate retention. | ||
|
|
||
| It can also be important to think about retention over different periods. Once users remain sticky through the first thirty days, measuring retention over months can also be revealing. | ||
|
|
||
| Different products will have different usage patterns. A social app with only one or two visits a month might be a failure, while the same retention pattern for a finance product might be a success. | ||
|
|
||
| # Retention setup | ||
|
|
||
| We can measure retention in PostHog using the **retention insight**. | ||
|
|
||
| This works by picking two events, and choosing a timeframe to measure against. | ||
|
|
||
| Let's say we want to measure retention of new users, based on whether they return to the product at all over the week after signing up. | ||
|
|
||
| 1. Baseline event: this is where we start measuring. We could choose an event like identify, or a custom event that's created to represent a signup. We could also start from an event that represents activation. | ||
| 2. Retention event: something we can measure related to the ongoing usage we hope to see. For our simple example, any pageview would work fine. But you could also be more specific, choosing a defined action or adding filters. This is helpful if there's a high value activity you want to measure, rather than any usage at all. | ||
| 3. Timeframe: we'd set this for **any of the next 7 days**. Retention measurement is granular: you can choose a timeframe from hours to months. | ||
|
|
||
| The result is a table that shows you, for any given day, what percentage of users returned, and how long it took them. | ||
|
|
||
| ## Reading a retention table | ||
|
|
||
| 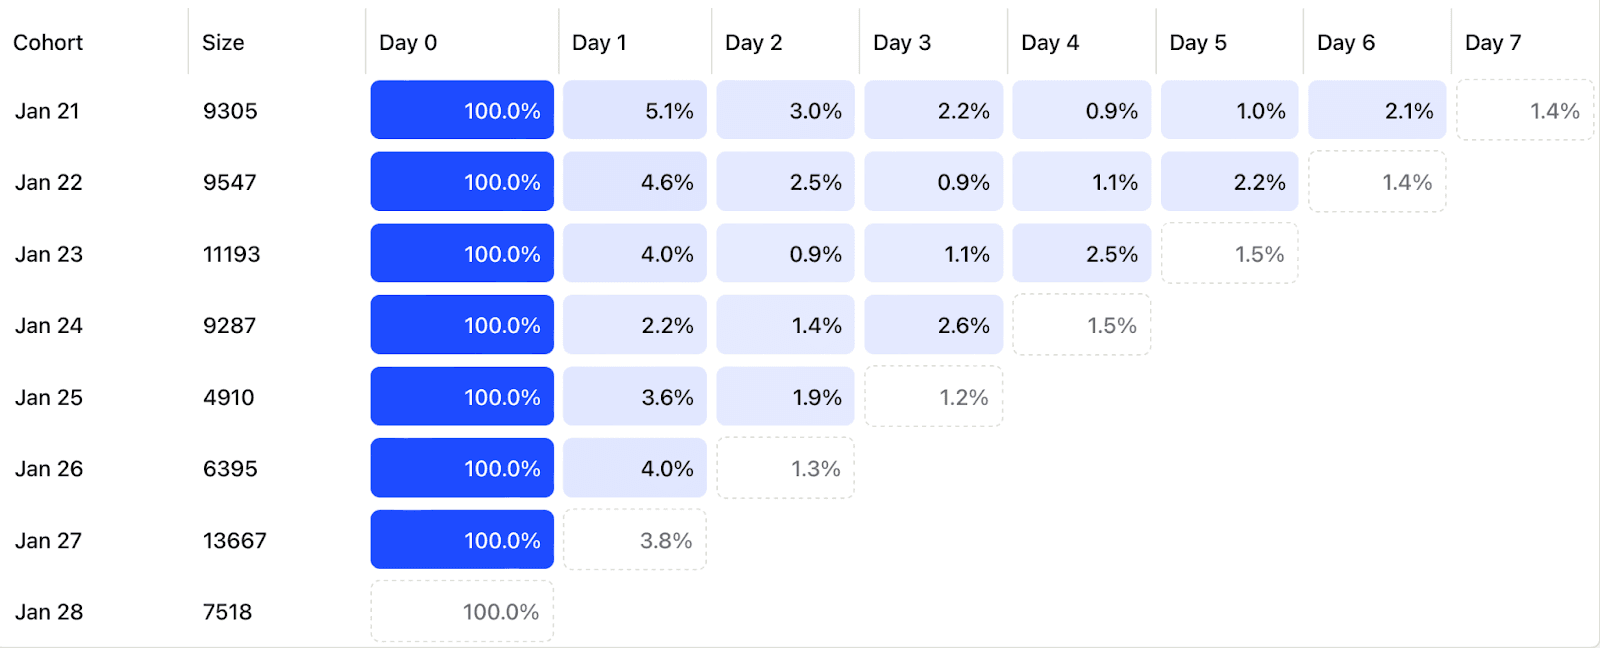 | ||
|
|
||
| Each day in the reporting period of a retention table gives us a cohort of users who did our baseline event. That's why Day 0 is always 100%: it's where we start measuring. | ||
|
|
||
| For each period after day zero, the table reports the percentage of users who performed the retention event. | ||
|
|
||
| Days marked with dotted lines represent incomplete data. | ||
|
|
||
| So: for the **9,547 people** who performed the baseline on **January 22**, 2.5% came back by day 2, and 2.2% came back by day 5\. We don't yet have complete data for day six. | ||
|
|
||
| <Admonition icon="IconPencil" title="Retention planning"> | ||
|
|
||
| With all this in mind, let's plan for retention. | ||
|
|
||
| - What's our baseline event? | ||
| - What's our retention event? | ||
| - What timeframe do we want to measure? | ||
|
|
||
| </Admonition> | ||
|
There was a problem hiding this comment. I feel like this retention section ends on a weird not. like, i'm expecting a final point or some further reading. i suppose we could send people to stuff around how to improve retention? |
||
|
|
||
| ## Further reading | ||
|
|
||
| - [The most useful customer retention metrics, ranked](/product-engineers/customer-retention-metrics) | ||
| - [Retention rate vs. churn rate](/product-engineers/churn-rate-vs-retention-rate) | ||
There was a problem hiding this comment.
Choose a reason for hiding this comment
The reason will be displayed to describe this comment to others. Learn more.
The big problem I have with this is that PostHog is more than just product analytics. I'm not even sure it is a good place to start. Web analytics, autocapture, and session replay (maybe even surveys) are all likely more useful in the earliest days.
There was a problem hiding this comment.
Choose a reason for hiding this comment
The reason will be displayed to describe this comment to others. Learn more.
Basically like this: https://posthog.com/founders/early-stage-analytics
There was a problem hiding this comment.
Choose a reason for hiding this comment
The reason will be displayed to describe this comment to others. Learn more.
the way I'm thinking about this is this is just V1. it makes sense to start with product analytics mainly because: