This presentation will show you examples of what you can do with Liascript, including:
- Presenting code and LaTeX equations
- Including computations in slide output
- Image, video, and iframe embedding
- Elegant transitions and animations
- Printing to PDF via Liascript Exporter
...and much more
{
  "@context": "https://schema.org/",
  "@type": "LearningResource",
  "@id": "https://elixir-europe-training.github.io/ELIXIR-TrP-TeSS/",
  "http://purl.org/dc/terms/conformsTo": {
    "@type": "CreativeWork",
    "@id": "https://bioschemas.org/profiles/TrainingMaterial/1.0-RELEASE"
  },
  "description": "TeSS, how can I help you? This is our interactive hands-on course about efficient use of the ELIXIR TeSS platform.",
  "keywords": "FAIR, OPEN, Bioinformatics, Teaching, TeSS",
  "name": "TeSS, how can I help you?",
  "license": "https://creativecommons.org/licenses/by/4.0/",
  "educationalLevel": "beginner",
  "competencyRequired": "none",
  "teaches": [
    "search events and material in TeSS via direct and faceted search",
    "add manually and automatically events and material to TeSS",
    "extract events and material from TeSS by using TeSS widgets"
  ],
  "audience": "training providers",
  "inLanguage": "en-US",
  "learningResourceType": [
    "tutorial"
  ],
  "author": [
    {
      "@type": "Person",
      "name": "Bruna Piereck"
    },
    {
      "@type": "Person",
      "name": "Olivier Sand"
    },
    {
      "@type": "Person",
      "name": "Alexander Botzki"
    }
  ],
  "contributor": [
    {
      "@type": "Person",
      "name": "Yasmine Maes"
    },
    {
      "@type": "Person",
      "name": "Finn Bacall"
    },
    {
      "@type": "Person",
      "name": "Munazah Andrabi"
    }
  ]
}- Many syntax highlighting themes available1
- Three subsequent backticks indicate a stack code block
Example for an R script
# Define a server for the Shiny app
function(input, output) {

  # Fill in the spot we created for a plot
  output$phonePlot <- renderPlot({
    # Render a barplot
  })
}- grouped code-blocks are simply attached to each other1
- code-blocks can be visible or hidden
let who = data.first_name + " " + data.last_name;

if(data.online) {
  who + " is online"; }
else {
  who + " is NOT online"; }
{
"first_name" : "Sammy",
"last_name" : "Shark",
"online" : true
}#| echo: true
#| fig-width: 10
#| fig-height: 4.5
library(ggplot2)
png(file="out2.png")
ggplot(mtcars, aes(hp, mpg, color = am)) +
geom_point() +
geom_smooth(formula = y ~ x, method = "loess")
@runR
MathJax rendering of equations to HTML1
$$ \begin{gather*} a_1=b_1+c_1\ a_2=b_2+c_2-d_2+e_2 \end{gather*}
\begin{align} a_{11}& =b_{11}& a_{12}& =b_{12}\ a_{21}& =b_{21}& a_{22}& =b_{22}+c_{22} \end{align} $$
Arrange content into sub-slides
{{0-1}}
Motor Trend Car Road Tests
The data was extracted from the 1974 Motor Trend US magazine, and comprises fuel consumption and 10 aspects of automobile design and performance for 32 automobiles.
{{1}}
knitr::kable(head(mtcars)[,c("mpg", "cyl", "disp", "hp", "wt")])@runR
Lists can optionally be displayed incrementally1:
{{1}} First item
{{2}} Second item
{{3}} Third item
You can also use the following as content elements1
{{0-1}}
-
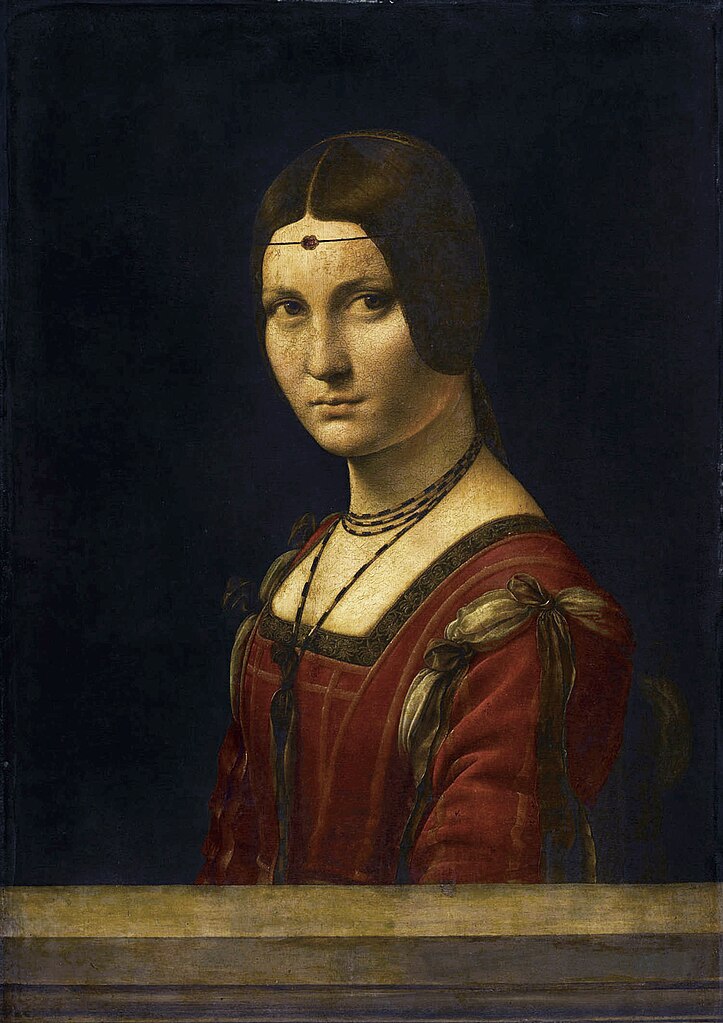
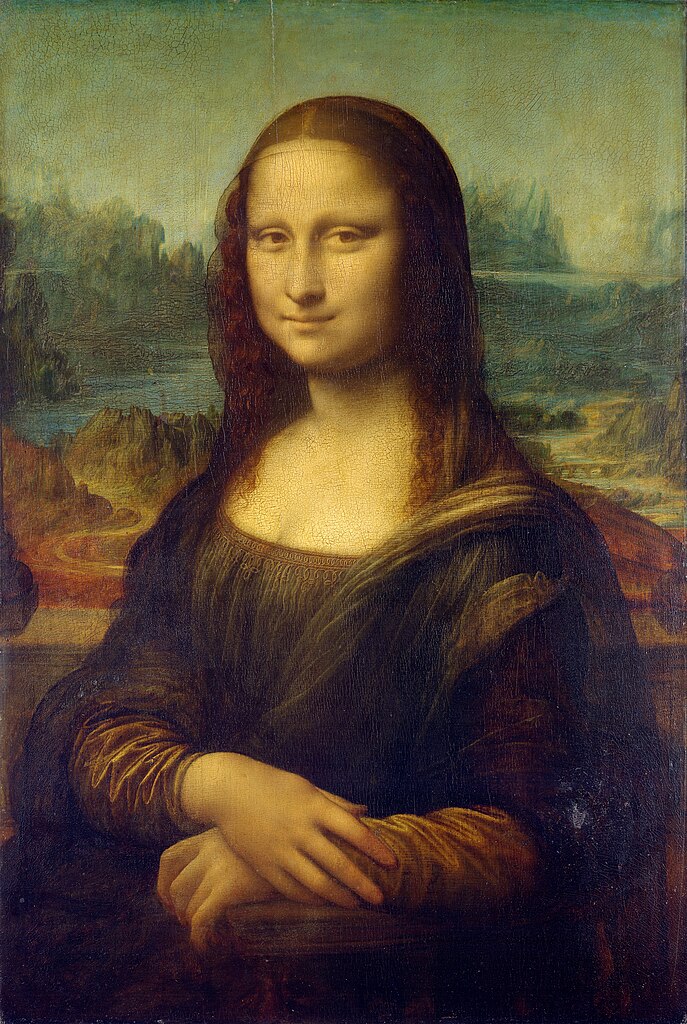
An image
- Syntax:

- Syntax:
-
An image gallery
{{1}}
-
A video
-
YouTube:
!?[The Future of Programming](https://www.youtube.com/watch?v=8pTEmbeENF4){{2}}
-
-
A sound clip
-
Syntax:
?[soundcloud](https://soundcloud.com/glennmorrison/beethoven-moonlight-sonata){{3}}
-
-
An oEmbed or Iframe
-
Syntax:
??[SketchFab](https://sketchfab.com/3d-models/familienschacht-freiberg-germany-7c7d30506c554385a4a4321366e2e601){{4}}
-
Position images or other elements at precise locations
| Filter | Value |
|---|---|
| Grayscale | <script input="range" value="0" input-always-active output="grayscale"> @input </script> |
| Brightness | <script input="range" value="1" min="0" max="10" step="0.1" input-always-active output="brightness">@input</script> |
| Contrast | <script input="range" value="1" min="0" max="10" step="0.1" input-always-active output="contrast">@input</script> |
| Saturation | <script input="range" value="1" min="0" max="10" step="0.1" input-always-active output="saturation">@input</script> |
{{0-1}}
png(file="out.png")
library(ggplot2)
ggplot(mtcars, aes(hp, mpg, color = am)) +
  geom_point() +
  geom_smooth(formula = y ~ x, method = "loess")
@runR
{{1}}
knitr::kable(mtcars)@runR
Reading loud works best in Google Chrome and Edge.
{{English Female |>}}
The film that I saw [[(that)|those|these|then]] night wasn’t very good. It was all [[ about ]] a man [[ who ]] built a time machine so he [[ could ]] travel back in time. It took him ages and ages [[ to ]] build the machine.
Use the icon macro to display your organisation's logo on top of the slides.
It works the same as for the logo macro.1
<!--
# define this in the sectio on top of the markdown file
icon: ./pics/logo.png
-->
Include Jupyter widgets and htmlwidgets in your presentations
leaflet is not installed in the CodeRunner, most probably possible via templates
#| echo: false
#| fig-height: 5
library(leaflet)
leaflet() %>%
  addTiles() %>%  # Add default OpenStreetMap map tiles
  addMarkers(lng=174.768, lat=-36.852, popup="The birthplace of R")
@runR
::: footer Learn more: Jupyter widgets, htmlwidgets :::
But, since JavaScipt is natively supported, we can also use the following code to create a map, the example was taken from the leaflet documentation.
<script run-once> let map = L.map('map').setView([-36.852, 174.768], 13); L.tileLayer('https://tile.openstreetmap.org/{z}/{x}/{y}.png', { attribution: '© OpenStreetMap contributors' }).addTo(map); L.marker([-36.852, 174.768]).addTo(map) .bindPopup('The birthplace of R.') .openPopup(); console.log("map created") </script>Turn presentations into applications with Observable and Shiny. Use component layout to position inputs and outputs.
ojs_define(actors = data.frame(
  x = rnorm(100),
  y = rnorm(100)
))
//| panel: sidebar
viewof talentWeight = Inputs.range([-2, 2], { value: 0.7, step: 0.01, label: "talent weight" })
viewof looksWeight = Inputs.range([-2, 2], { value: 0.7, step: 0.01, label: "looks weight" })
viewof minimum = Inputs.range([-2, 2], { value: 1, step: 0.01, label: "min fame" })
//| panel: fill
import { plotActors } from './actors.js';
plotActors(actors, talentWeight, looksWeight, minimum)
::: footer Learn more: Observable, Shiny, Component Layout :::
longitude: <script default="13.33125" input="range" output="longitude" input-always-active>@input</script>
latitude: <script default="50.92558" input="range" output="latitude" input-always-active>@input</script>
<script run-once="true" style="display: block"> fetch("https://api.open-meteo.com/v1/forecast?latitude=@input(`latitude`)&longitude=@input(`longitude`)&hourly=temperature_2m") .then(response => response.json()) .then(data => { let table = "\n" table += "| Time | Temperature |\n" table += "| ---- | ----------- |\n" for (let i=0; i < data.hourly.time.length; i++) { table += "| " + data.hourly.time[i] + " | " + data.hourly.temperature_2m[i] + " |\n" } send.lia("LIASCRIPT: "+table) } ) .catch(e => { send.lia("ups, something went wrong") }) "waiting for data..." </script>Quickly jump to other parts of your presentation by opening the title panel on the left side.
Presentation view, Slides view, and the Textbook view.
-
Live side-by-side preview for any text document in Github.dev
Using the GitHub builtin Web editor, you can install the following extension to preview your course while editing...
-
Or LiveEditor:
As a native browser app
-
Visual-Studio-Code
- liascript-preview:
Is a tiny previewer that, if it was toggled (
Alt+L), updates the view on your course each time you save your document. - liascript-snippets:
If you start typing
liain your Markdown document you switch on a fuzzy search, that contains a lot of LiaScript help, examples, and snippets.
Detailed installation instructions can be found here
- liascript-preview:
Is a tiny previewer that, if it was toggled (
-
DevServer
To be used in conjunction with any other editor
Get the project from:
Learn more: Jupyter, VS Code, Text Editors
- Lia Android app (presentations look great on mobile, swipe to navigate slides)
- Footer & Logo (optionally specify custom footer per-slide)
- Auto-Slide (step through slides automatically, without any user input)
- Multiplex (allows your audience to follow the slides of the presentation you are controlling on their own phone, tablet or laptop).


