| home | roadmap | issues | ©2022,2023 by tim menzies |

![]()
This section is about "stakeholder testing", which we might also call "fishing", which is the process of prioritizing many things, without knowing too much about each thing.
We can do this for ethical reasons (to address the issues raised above) or we can do improve standard acceptance testing. Whatever the goal, much of the machinery is the same.
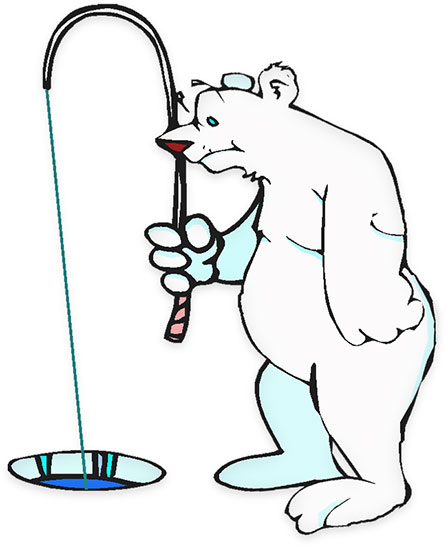
Consider a polar bear, going fishing, by bashing holes in the ice1
- Above the ice, she can see for miles
- Where the other bears are fishing
- Where the ice is cracking (due to patches of heat)
- Where there are the islands poking through the ice
- Where are the holes from yesterday,
- etc
- But below the ice
- She has zero disability through the ice
- She can only check for fish in the tiny areas within her ice holes.
- Problem: she only has the strength and the time to bash a few holes in the ice per day
- So she must bash a few holes, learning what she can along the way, trying to to make her next guess (about where to bash) better.
It turns out that "fishing" is a very common problem. Consider:
- You are the captain of a fishing boat. Your boat has a crew of six. Each day, before you catch anything, you waste hours burning expensive fuel traveling between promising fishing spots. What software help you look at the ocean and find the fish faster?
- You've need a car for Monday but you aren't really sure what kind you like. After a day of going to car yards, and doing a few test drives, you buy a car. Can software help you narrow down how many cars you need to look at?

- You are an architect trying to design houses with a house with lots of light but no glare. You client is a busy (and fussy) person and before you show them all the possible designs, can software help you prune them back to an interesting subset?
- You are the manager of a software project, with many tricks for running a project. Any one project uses just a few of those tricks, but which one to apply? Can software help you learn which tricks are best (and wish to avoid)?
- Your software is being assessed by a focus group (a set of stakeholders). Your software is complex and this group has limited time to understand it and certify that the software is behaving reasonably2.
- Software analytics learn models from data. Data labels are often incorrect3 and so they need to be checked before they are used. But data sets can be huge, and relabelling everything can be so expensive. So can our software tells us what is the least number of examples to label?

- A software engineer can't try options but after a few experiments, they ship a product. For example:
- Data miners are controlled by billions of hyper-parameter options that control (e.g.) the shape of a neural net or how many neighbors your use for classification4. These parameters let you trade off (e.g.) how many mistakes you tolerate versus how many results you return; or accuracy versus fairness5.
- MySQL's Makefile has billions of configurations options, each of which means your SQL queries take different times to run and use different energy.
BTW, in the above two diagrams, there is an outer envelope of solutions with an uninterrupted view of the "utopia" point (where all goals have best values). That envelope is called the "Pareto frontier" and contains the solutions (seen so far) that cannot be changed without losing on at least one objective. For example, in AOF, COMPAS, and Donors Choose, that frontier is the blue line.
| What | Notes |
|---|---|
| X | inputs |
| Y | goals |
| F | maps X to Y; i.e. Y=F(X) |
| W | weights on the goals |
| Z | parameters controlling the learners that generates F |
| B | Background knowledge, which we may not have access to |

We seek a mapping
-
$X$ and$Y$ are sets of decisions and goals - Often
$|X| \gg |Y|$ , i.e. there are usually more decisions and goals. - Often, even if
$Y$ exists, it may be too expensive to collect (e.g. for a drug trial, it may be required to study the effects of a drug across 1000s of people for many months) - We might have access to a set of weights
$W$ for each$Y$ value; e.g. if$W_i<0$ then we might seek solutions that minimize$Y_i$ . - Under the hood, we might also have
$Z$ , a set of hyper-parameters that control the algorithms that find$F$ . - Finally, there may or may not be some background knowledge
$B$ which we can use to guide our analysis.
In all the examples above,
it was cheap to sample
- e.g. describing the ocean is much cheaper than sailing around it all day looking for fish
- e.g. listing the Makefile options within SQL is faster than compiling and testing each one,
Only some subset of
There can be many goals
- If we cannot satisfy all goals, we explore trade-offs between them (known as satisficing6).
- And in those cases, sometimes the exploration can be just (or more) insightful than actually getting find an answer.
- Vilfredo Pareto: Give me the fruitful error any time, full of seeds, bursting with its own corrections. You can keep your sterile truth for yourself.
Historically, in the SE community this is known as search-based software engineering
- Which explores issues like:
- What is the smallest set of test cases that covers all branches in this program?
- What is the best way to structure the architecture of this system to enhance its maintainability?
- What is the set of requirements that balances software development cost and customer satisfaction?
- What is the best allocation of resources to this software development project?
- What is the best sequence of refactoring steps to apply to this system?
- Using techniques like local search, tabu search, simulated annealing, genetic algorithms, and hill climbing. Having tried many of those, I now prefer something called "landscape analysis" where data mining divides up a problem (after which optimization is just a matter of finding the difference between good and bad divisions).
Depending on who you talk to, this process has different names.
- In the AI literature, stakeholder testing could be called active learning7where access the
$y$ labels incurs some cost and we want to create a model$f$ at minimal cost. Classic active learning assumes that the oracle labeling the data is a human (in some human-in-the-loo[ system) and the labels are all accurate. Semi-supervised learning is a special kind of active learning where labels can be inaccurate and can come from multiple-sources. The best active learners my grad students ever achieved with human-in-the-loop methods needed to label 10-30% of the data8. But with semi-supervised learning, we are now down to 2.5%, or less9. - In the SE literature, stakeholder testing could be called acceptance testing, with a few twists:
| Stakeholder testing needs... | Notes |
|---|---|
| Optimizing | High-level stakeholders do not hunt bugs for fun... they really are seeking ways to avoid those bugs. So we need to learn the gradients along which the system can slip, and how to nudge the system along those gradients to places of better behavior |
| Multi-objective reasoning | Stakeholders often have competing goals (e.g. "better" and "faster" and "cheaper"). |
| Black-box | Most systems are so complex that it is hard to reason about their interior processing. Hence, we try to learn what we can from the input,output behaviour |
| XAI (explainable AI)) | Stakeholders are often done by non-technicals (e.g. representatives from the broader user community) so they seek a "big picture overview" rather than lots of details. |
| Model-based | between this audit and the next, we need some way to continue testing the system (so we can check if the system has gone off the rails and needs an emergency set of new acceptance tests). So there has to be some product from the acceptance testing that can be applied while we wait for the next acceptance test. |
| Semi-supervised learning | These tests often has a limited budget. Stakeholders want to complete their testing in a parsimonious manner since they can get back to everything else that needs their attention. Hence we must not demand outputs for every possible input, just some of the inputs. |
Why limited budgets? Well, if you really want to explore a set of examples, in-depth, with human beings then you may be surprised on long it takes to examine even a few examples:
- Knowledge elicitation techniques like repertory grids take a while to complete; e.g. up to an hour for two people to discuss, in detail, the differences between 10 examples described in 10 attributes.
- Valerdi 10 once recruited 40 experts to three panel sessions to review an effort model. Each panel took three hours so, on total, this study required 3 × 3 × 40/7.5 = 48 days to complete. He offers the heuristic that training data needs 5 to 10 examples per column; i.e., the fewer the columns, the less is required for calibration.
- Brendon Murphy 11 from Microsoft comments that the high cost of interpretation implies that there is never enough time to review all the defect data or all the models generated by the data miners. Hence, he is very interested in methods that reduce the number of columns and rows of data that need to be discussed with users.
Further to the last point, we know that humans are often asked to work perform way beyond their acceptance test capacity:
- Ben Green2 warns that many recent policies require humans-in-the-loop to review or audit decisions from software model.
- But people (including experts) are susceptible to “automation bias” (involving omission errors) failing to take action because the automated system did not provide an alert—and commission error.
- These omissions means that oversight policies can lead to the reverse of their desired effect by “legitimizing the use of faulty and controversial algorithms without addressing (their fundamental issues)"
The dream of TESTED is that, at least to some extent, we can address some of Ben Green's problems with better methods for reducing the effort associated with acceptance testing.
This section offers an example of fishing tool. This example has to important points:
- It is a baseline implementation. You are meant to be critical of it, to want to improve it.
- For example, the following results comes from only one small data set
- So there is much more work to do here.
- The example comes with an evaluation criteria with which we can compare different fishing tools
In an unpublished paper from his Ph.D. thesis Jianfeng Chen proposed a way to quickly sample a large space, with just a few queries:
- evaluate
$B$ examples - explore the
${B \choose 2}=B(B-1)/2$ differences between them e.g.$N=20$ evaluations gives us information of 190 examples - i.e. score via yvap/xgap =
$\Delta{Y}/\Delta{X}$ - so the best thing has the smallest change in
$X$ that leads to the biggest change in$Y$ .
- so the best thing has the smallest change in
How:
- For some fixed budged
$B$ - Evaluate
$B$ examples and compare their$X$ and$Y$ column values by$v_x=\Delta{Y}/\Delta{X}$ - Rank every non-evaluated example by the sum of their
$v_x$ scores - Best guess= first
$B$ items- Evaluate the best guesses and perform a final sort on the best
$B$ items- Alert: this means that we are actually doing
$2B$ evals.
- Alert: this means that we are actually doing
- Evaluate the best guesses and perform a final sort on the best
- Compare that final sort order against "ground truth"
- i.e. let some omniscient being rank all the examples by their Y-scores.
For example, for 93 examples and a budget of
- Here the goals are "reduce effort, defects".
- And the
$X$ attribute values are 2=low, 3=nominal, 4=high, 5= very high
Note that prec
(precedent less, have we done this before) scores really well while
rely (required reliability) looks kind of wishy wahsy
prec	{:4 6 *
	 :h 93 ******************
	}
flex	{}
resl	{}
team	{}
pmat	{:2 13 **
	 :3 40 ********
	 :4 45 *********
	}
rely	{:3 35 *******
	 :4 32 ******
	 :5 31 ******
	}
data	{:2 41 ********
	 :3 5 *
	 :4 7 *
	 :5 45 *********
	}
cplx	{:2 6 *
	 :3 28 *****
	 :4 34 ******
	 :5 29 *****
	 :6 0
	}
ruse	{}
docu	{}
time	{:3 38 *******
	 :4 3
	 :5 45 *********
	 :6 13 **
	}
stor	{:3 31 ******
	 :4 2
	 :5 41 ********
	 :6 24 ****
	}
pvol	{:2 55 ***********
	 :3 19 ***
	 :4 24 ****
	}
acap	{:3 33 ******
	 :4 14 **
	 :5 51 **********
	}
pcap	{:3 44 ********
	 :4 10 **
	 :5 45 *********
	}
pcon	{}
apex	{:2 32 ******
	 :3 26 *****
	 :4 9 *
	 :5 30 ******
	}
plex	{:1 36 *******
	 :2 33 ******
	 :3 22 ****
	 :4 7 *
	}
ltex	{:1 31 ******
	 :2 32 ******
	 :3 0
	 :4 35 *******
	}
tool	{:3 73 **************
	 :4 26 *****
	}
site	{}
sced	{:2 100 ********************
	}
As to how well that scores, here's the results of a budget of 12, 16,20 (which is really 24,32,40). Note that 12 might be too little and 20 might be too much


These charts are a little verbose to print, so here's an executive summary. Lets ask how well we are doing
| at x=1 | evaluations = B | median found |
|---|---|---|
| 12 | 2 | |
| 16 | 1 | |
| 20 | 1 | |
| 24 | 1 | |
| 28 | 1 | |
| 32 | 1 | |
| 36 | 1 | |
| at x=5 | evaluations = B | median found |
| 12 | 9 | |
| 16 | 7 | |
| 20 | 7 | |
| 24 | 7 | |
| 28 | 7 | |
| 32 | 7 | |
| 36 | 9 | |
| at x=10 | evaluations = B | median found |
| 12 | 35 | |
| 16 | 24 | |
| 20 | 21 | |
| 24 | 19 | |
| 28 | 19 | |
| 32 | 18 | |
| 36 | 18 |
Now the above is interesting, but I hope we can do much better. Maybe any of the following could be useful? Or maybe you can do better?
- The above only handles discrete values. How to handle
numerics?
- and if we increment a bucket, what kernel should we apply left and right
- Cluster on x, label on item, then compute
$\Delta{x}$ and apply to all items on cluster - The above used a score fraction good/(good + bad) is only one of dozens of alternatives (see table 3 of this paper
- Restrict the example scoring to the highest entropy values.
- Do not use ygap, but use the delta computed by Zitlzer
Footnotes
-
Apologies to all my polar bear readers: I don't actually know if you do this. But the metaphor of a vast exposed expanse, floating on top of a hidden space of desired goals, was too much to resist. ↩
-
B. Green, “The flaws of policies requiring human oversight of government algorithms,” Computer Law & Security Review, vol. 45, p. 105681, 2022. ↩ ↩2
-
H. Tu, Z. Yu and T. Menzies, "Better Data Labelling With EMBLEM (and how that Impacts Defect Prediction)," in IEEE Transactions on Software Engineering, vol. 48, no. 1, pp. 278-294, 1 Jan. 2022, doi: 10.1109/TSE.2020.2986415. https://arxiv.org/pdf/1905.01719.pdf "We compare the time required to label commits from 50 projects via EMBLEM of manual means. Assuming we were paying Mechanical Turk workers to perform that labelling, then manual labelling would cost $320K and 39,000 hours (assuming pairs of workers per commit, and a 50% cull rate for quality control). Using EMBLEM, that same task would cost $40K and 4,940 hours; i.e. it would be 8 times cheaper." ↩
-
class sklearn.neighbors.KNeighborsClassifier(n_neighbors=5, *,
weights='uniform',
algorithm='auto',
leaf_size=30,
p=2,
metric='minkowski',
metric_params=None,
n_jobs=None)¶ ↩ -
A. F.Cruz, P. Saleiro, C. Belém, C. Soares and P. Bizarro, "Promoting Fairness through Hyperparameter Optimization" 2021 IEEE International Conference on Data Mining (ICDM), 2021, pp. 1036-1041, doi: 10.1109/ICDM51629.2021.00119. ↩
-
From Wikipeda: Satisficing (satisfy + suffice) = a decision-making strategy or cognitive heuristic. Search through available alternatives till an acceptability threshold is met.i Introduced by Herbert A. Simon in 1956 to explain the behavior of decision makers under circumstances in which an optimal solution cannot be determined. He maintained that many natural problems are characterized by computational intractability or a lack of information, both of which preclude the use of mathematical optimization procedures. He observed in his Nobel Prize in Economics speech that "decision makers can satisficed either by finding optimum solutions for a simplified world, or by finding satisfactory solutions for a more realistic world. Neither approach, in general, dominates the other, and both have continued to co-exist in the world of management science". ↩
-
Settles, Burr. "Active learning literature survey." (2009). ↩
-
Z. Yu, C. Theisen, L. Williams and T. Menzies, Improving Vulnerability Inspection Efficiency Using Active Learning,", in IEEE Transactions on Software Engineering, vol. 47, no. 11, pp. 2401-2420, 1 Nov. 2021, doi: 10.1109/TSE.2019.2949275. ↩
-
H. Tu and T. Menzies, i "FRUGAL: Unlocking Semi-Supervised Learning for Software Analytics," ↩
-
R. Valerdi Heuristics for systems engineering cost estimation IEEE Syst J, 5 (1) (2011), pp. 91-98 ↩
-
B. Murphy The difficulties of building generic reliability models for software Empir Softw Eng, 17 (2012), pp. 18-22 ↩