Add "toggle legend" button #4042
Comments
|
Hi @AdnanBoota I'm a little confused here. But it sounds like you can get the desired result by toggling https://plot.ly/javascript/reference/#layout-showlegend for example: var fig = {
data: [/* */],
layout: {}
}
Plotly.react('graph', fig)
fig.layout.showlegend = false
Plotly.react('graph, fig)
fig.layout.showlegend = true
Plotly.react('graph, fig) |
|
Hi @etpinard, Again, thanks for quick response! Regards, |
We could potentially add this. That said, personally, I don't think this would be a valuable addition to the library. But, I can be convinced otherwise. |
|
What could be interesting is to add a way to make "toggle" updatemenu buttons. For example, Plotly.newPlot('graph', [{
type: 'pie',
labels: ['a', 'b', 'c'],
values: [1, 2, 3]
}], {
updatemenus: [{
type: 'buttons',
buttons: [{
label: '≡',
method: 'relayout',
args: ['showlegend', false],
args2: ['showlegend', true] // NEW attribute !
}]
}]
}would be enough to effectively close this ticket. |
|
Hi @etpinard Yes that also sounds good, button in Thanks! |
|
cc @catherinezucker - this would allow us to create trace visibility buttons as well, for traces that don't have this functionality in the legend. |
|
The trace-visibility thing could also be addressed via #2642 |
|
Thank you very much! you saved me! @etpinard @AdnanBoota This worked for me. Facing similar issue |
Hi Team Plotly,
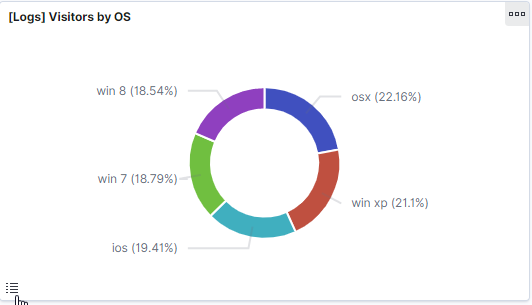
I was wondering if it is possible to add a "legend minimize/maximize (show/hide)" feature in Piecharts. I want to show/hide legend with a button (screenshots attached), so that I can use the space for the chart and also see legend whenever needed.
This feature would be very useful in cases where we have simply too many items in the legend or legend items have long text. In such cases, the user would like to resolve the label by simply hovering over the item, instead of looking for it in the legend.
I actually got this idea from Kibana dashboard (https://demo.elastic.co/app/kibana#/dashboard/edf84fe0-e1a0-11e7-b6d5-4dc382ef7f5b). They have legend minimization in their pie charts.
I'm using this library in ReactJS, will the Plotly.js also update the ReactJS package, any suggestion on this?
Thank you very much for your help.
Regards,

Adnan
The text was updated successfully, but these errors were encountered: