-
-
Notifications
You must be signed in to change notification settings - Fork 959
Debug coc.nvim
Coc.nvim mostly written in typescript, which compiles to javascript, if you know javascript or how nodejs works, it would be easier for debug the source code.
After cloning the repo, you need build the source code first, this could be done by just run:
yarn install
it could be slow first time, since some dependencies need to be downloaded. This command would also invoke yarn clean and yarn build commands. yarn clean would remove build directory which contains binary release, yarn build would build your source code.
To build source code after make changes, run:
yarn build
which use tsserver to compile typescript to javascript.
However, run yarn build takes some time, to get faster increment build, you need to run:
yarn watch
which enable watch option for tsserver, it would be much faster for rebuild source code.
After each compile, restart coc service by :CocRestart to make new server take control.
Warning: your can't use stdout by console.log or stdout.write, since coc have to use stdio for communication between neovim.
You can use console.error to write string message, like:
console.error('my error')the message would be echoed in vim, this method is quite limited.
The default log level is info, so you won't get error or trace messages.
To change the log level, run:
export NVIM_COC_LOG_LEVEL=debug
in your shell.
Or add:
let $NVIM_COC_LOG_LEVEL = 'debug'at the start of your .vimrc file.
Most files import logger module for debug purpose, like:
const logger = require('./util/logger')('workspace')You can use logger to debug any variable, like:
logger.debug('variable:', variable)Use command node -e 'console.log(path.join(os.tmpdir(), "coc-nvim.log"))' to get the log file, and tail command to trace the log.
Add:
let g:coc_node_args = ['--nolazy', '--inspect-brk=6045']
to your .vimrc
After restart coc, you will get error message like:
[vim-node-coc]: Debugger listening on ws://127.0.0.1:6045/cd7eea09-c79f-4100-b4a0-bfbb43e94f48
For help, see: https://nodejs.org/en/docs/inspector
it means debugger protocol is started.
Open url chrome://inspect in chrome, make sure Discover network targets is checked and then click configure... button:

then add 127.0.0.1:6045 to Target discovery settings.
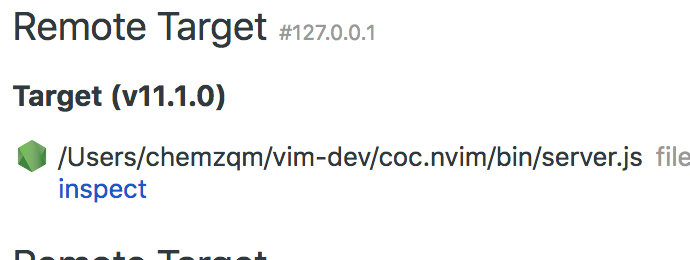
Checkout remote target section, and then click inspect for the nodejs target:
