-
Notifications
You must be signed in to change notification settings - Fork 1
/
Copy pathquant_notes.qmd
196 lines (133 loc) · 12.5 KB
/
quant_notes.qmd
1
2
3
4
5
6
7
8
9
10
11
12
13
14
15
16
17
18
19
20
21
22
23
24
25
26
27
28
29
30
31
32
33
34
35
36
37
38
39
40
41
42
43
44
45
46
47
48
49
50
51
52
53
54
55
56
57
58
59
60
61
62
63
64
65
66
67
68
69
70
71
72
73
74
75
76
77
78
79
80
81
82
83
84
85
86
87
88
89
90
91
92
93
94
95
96
97
98
99
100
101
102
103
104
105
106
107
108
109
110
111
112
113
114
115
116
117
118
119
120
121
122
123
124
125
126
127
128
129
130
131
132
133
134
135
136
137
138
139
140
141
142
143
144
145
146
147
148
149
150
151
152
153
154
155
156
157
158
159
160
161
162
163
164
165
166
167
168
169
170
171
172
173
174
175
176
177
178
179
180
181
182
183
184
185
186
187
188
189
190
191
192
193
194
195
196
---
title: Conducting Research With Theoretical and Quantitative CS Research Strategies
author: Neil Ernst
date: Oct 2023
format:
revealjs:
theme: solarized
scrollable: true
incremental: false
footer: "©️ Neil Ernst"
---
## Learning Objectives
* Understand the landscape of CS research
* Learn a bit more about how folks in databases, systems, networks, and experimentally-dominated disciplines do their thing.
* Learn a bit about theory and formal proof techniques in the context of research. (How do you approach a problem? What do you do if you get stuck)
## Summary: Research Strategies

##
Quantitative studies: typically come from post-positivist paradigms ("objective truth"), focus on hypothesis testing,
Quantitative approaches: **lab** experiments or field experiments with users, often called controlled experiments when independent variables are accounted for.
The most dominant one in CS, **simulations** or data experiments, conventionally using some measure of accuracy on a set of sample data. Think Imagenet, Network traces, Github commits.
## Most often
- rely on statistical approaches to infer truths about the world
- or use simulation test results compared to some gold standard (labeled data, known results)
## Statistical experiments
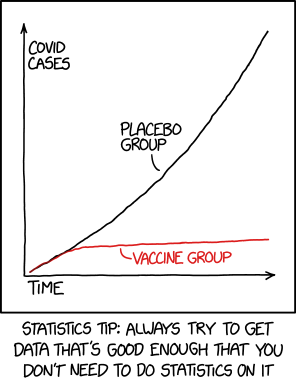
## Compare: multiple comparisons XKCD

## Control
Experiments use statistical techniques - Bayesian or frequentist - to draw inferences from a sample to a population. In these types of studies, we aim for *control* over the phenomena of interest. We get control by:
1. Being **strict and specific about our hypotheses**. We must precisely as possible define the constructs and associated measures we care about.
2. **Randomizing the assignment of subjects** to pools, in order to ensure balance between the groups.
3. Blocking the treatments to isolate the treatment, rather than the confounds (endogeneity).
A "quasi-experiment" is a study where there is less control and (usually) no randomization.
## Thought experiment
Consider [the following study](https://slate.com/technology/2013/07/statistics-and-psychology-multiple-comparisons-give-spurious-results.html) that looked at fertility and women's clothing. Central to that paper is the notion of fertility. In the paper, peak fertility is defined as 10-17 days post ovulation. When did ovulation happen? Why 10-17, and not 10-16? If you or your partner take a pregnancy test that is positive, when will the baby be born, assuming all goes well?
## Sampling
If you are using statistics, your goal is inference from your sample to a population. Therefore, precisely defining your sampling frame and eventual sample is essential. Often harder than it seems!
A great reference is Baltes and Ralph: https://arxiv.org/pdf/2002.07764.pdf
## Statistical Analysis
1. Not all studies need to try and generalize to a population. Exploratory research is pretty useful, even if you cannot conclude anything for a wider group. Not every study needs to report a p-value! Maybe you just want to say "hmm, here's something interesting".
2. You should be very clear about the assumptions baked into a given analysis approach. Cookie-cutter stats is a bad idea. For example, [Cohen's D categories are probably not right for your domain](https://www.sciencedirect.com/science/article/abs/pii/S1364661319302979).
## Stats and Bayes
3. I personally find Bayesian analysis to be much closer to the way I like to think about my data and analysis. It also gives a much richer notion of posterior distribution that can be used in many useful ways, esp for practical significance. A great book on [getting started with Bayesian inference is by McIlreath](https://xcelab.net/rm/statistical-rethinking/). The example I showed is from [Furia, Torkar, and Feldt](https://arxiv.org/abs/2101.12591)
## Replication and Open Science
In my view the thing that best lends evidence to the effect being true, and important, is more people doing studies that confirm something is happening. Replication is the act of conducting a close parallel to the existing study (strict) or similar in nature to test the hypothesis (conceptual). A meta-study can then be done on multiple individual studies to confirm an effect exists. However, **replications depend on open science**. If you don't make your data or analysis or study protocols available, others can't confirm your results.
## Replication tips
1. Publish an artifact if possible
2. Keep the artifact on a long-term repository, such as Zenodo or FigShare.
3. Licence the artifact.
4. Put everything you can into the artifact: protocol, data, analysis code, visualizations.
5. Consider registering your study first, if your journals support pre-registration.
## Bad Practices in Statistical Research
I direct you to the smells paper for more information. [Gelman's blog](https://statmodeling.stat.columbia.edu) is a fun survey of various issues. But broadly speaking, in experiments (in particular!) we need to worry about researcher bias:
## Bad smells
- Not using a theory to ground the experiment
- Not publishing bad results (file drawer)
- Suspiciously many results close to \alpha = 0.05
- Hypothesizing after results are known (HARK)
- Multiple comparisons problems (see the XKCD cartoon)
- Forking path problems
- Not measuring experimental power for a given effect size
- No causal analysis when it makes sense
## Causal modeling and Theory
In a lot of our work, there are existing theories about what should work.
> E.g., we know from accident studies how crowds of humans tend to behave in a fire.
Your simulation would be weird if it didn't acknowledge this pre-existing theory ("people will take their purses/bags with them in an airplane fire")
If the theory is particularly well understood, could use a *causal model* to sketch out the various factors.
A causal model (DAG) is very helpful at a) documenting your assumptions and b) clarifying what you are testing.
## Power and Effect Size
If we are looking for some effect of our intervention (e.g, a new networking algorithm), we should have some estimate as to what the effect **size** will be.
- E.g., is the algorithm going to improve latency by 10%? 20%?
- Everything has an effect! Really unlikely your intervention didn't cause some
Then, we should design our experiment or simulation to be able to actually **find this effect**! THis is statistical power.
## Errors
* Type II error: the probability you **don't** find an effect which is there (false negative).
* Type I error: the probability you find an effect which isn't there in reality (false positive)
* Type S error: the probability the effect you found has the wrong sign (direction).
* Type M error: the probability the effect you found has the wrong magnitude.
## Power calculations
- Low power and small effect sizes. See the [G*Power](https://stats.idre.ucla.edu/other/gpower/) tool.
Your pilot study analyzed with a Student *t*-test reveals that group 1 (N = 29) has a mean score of 30.1 (SD, 2.8) and that group 2 (N = 30) has a mean score of 28.5 (SD, 3.5). The calculated *P* value = .06, and on the surface, the difference appears not significantly different. However, the calculated effect size is 0.5, which is considered “medium” according to Cohen.
In order to test your hypothesis and determine if this finding is real or due to chance (ie, to find a *significant* difference), with an effect size of 0.5 and *P* of <.05, the power will be too low unless you expand the sample size to approximately N = 60 in each group, in which case, power will reach .80. For smaller effect sizes, to avoid a Type II error, you would need to further increase the sample size. Online resources are available to help with these calculations.
## Describing Limitations And Tradeoffs
If you do empirical research you should report on possible threats to the validity of your conclusions. Conventionally, one reports:
- **External validity** - about the generalizability of the results
- **Internal validity** - how well the tools chosen allow us to test the hypothesis.
- **Construct validity** - how well the constructs measure the phenomena of interest (e.g. fertility)
## Tradeoffs
For various reasons---cost, time, interest---researchers make tradeoffs in studies. For example, I might choose to interview people I know will respond positively, rather than cold-calling.
This is part of research. Properly understanding, and justyifying the tradeoffs is a good way to head off reviewers.
Not all tradeoffs are justifiable. "I didn't do all the work I should have because I wanted to watch a movie" is not a good tradeoff, no matter how you present it.
Chances are the reviewers will find them anyway! Better to head them off at the pass. [See Martin Robillard's post on this.](https://www.cs.mcgill.ca/~martin/blog/2015-04-29.html)
## Exercise: Tradeoffs
In pairs, take one of the papers you reviewed on HotCRP and identify 2 possible tradeoffs the paper/study made.
## Simulations
**Computational simulation studies** are studies that analyze data in a controlled, highly precise way. There are **data** simulations and model simulations.
In a model simulation, we define a model about how we think the world ought to work, then use simulation techniques - usually something probabilistic like Monte Carlo - to see how our model works. We then try to validate the model outputs against what we think should, or could, happen. Simulating the impact of virus spread on hospitalization is one example. Climate models are another. There's work at Facebook to simulate the social network, in order to test new features. Simulating a new network intrusion detection tool is another example: here, the new tool is our "theory" or model, and the
## Simulations
Here's Brandon:
> So in simulations, we have a number of problems, like: 1) not having a baseline or ground truth to validate the simulation itself, 2) not being able to reproduce data even when we have it (crowds are semi-chaotic and ill-conditioned, ie *very* sensitive to initial conditions and context), 3) choosing the right model when there are hundreds and few are validated in any real way or have extremely limited scope. (Haworth)
##
The other type of simulation is one where we run a precise data experiment, which accounts for a vast number of CS research papers.
Again, the specifics - such as which measures of accuracy to use - are highly specific to your field. A few best practices I know:
##
- Be clear what the gold set is. If you are lucky the field defines one, such as ImageNet (in which case, look for problems with bias and variance).
- Optimize the hyper parameters
- Account for data imbalance
- Use the train/test/validate split
- Run the tests multiple times to get an average
- [Other bad smells listed here.](https://arxiv.org/abs/1803.05518)
## Formal Proof Approaches
Commonly used approaches include
- Explicit definitions of assumptions, problem statements, axioms;
- taking existing techniques and applying them to new problems;
- doing limited simulation to convince yourself of the approach;
- Learning and leveraging mathematical approaches.
- Solving restricted versions of the problem.
- Nearly every theory contribution comes with a proof.
I think every CS student should have a good understanding of theoretical CS tools such as proof by induction, contradiction, formal logic, etc.
## Readings (before class)
* van Smeden, "A Very Short List of Common Pitfalls in Research Design, Data Analysis, and Reporting", https://journals.stfm.org/primer/2022/van-smeden-2022-0059/
### Optional and Recommended
* [Doing good KDD research](https://www.cs.ucr.edu/~eamonn/Keogh_SIGKDD09_tutorial.pdf)
* http://www.jfsowa.com/ikl/Stonebraker.pdf
* [V&V of crowd models](https://ieeexplore.ieee.org/stamp/stamp.jsp?arnumber=5679166)
* [Manuel Blum - theory research tips](http://www.cs.cmu.edu/~mblum/research/pdf/grad.html)
* [History of Complexity](https://people.cs.uchicago.edu/~fortnow/papers/history.pdf)
* [importance of effect size](https://www.ncbi.nlm.nih.gov/pmc/articles/PMC3444174/)
* [Empirical Standards in SE](https://github.com/acmsigsoft/EmpiricalStandards)
* Campbell and Stanley, "Experimental and Quasi-Experimental Designs for Research". The classic.
* Richard McElreath, "Statistical Rethinking" excellent text on Bayesian statistical inference.
* Lakens, "Improving Your Statistical Inferences" - coursera course