| id | elm | ||||
|---|---|---|---|---|---|
litvis |
|
@import "css/litvis.less"
import VegaLite exposing (..)This document best viewed in litvis
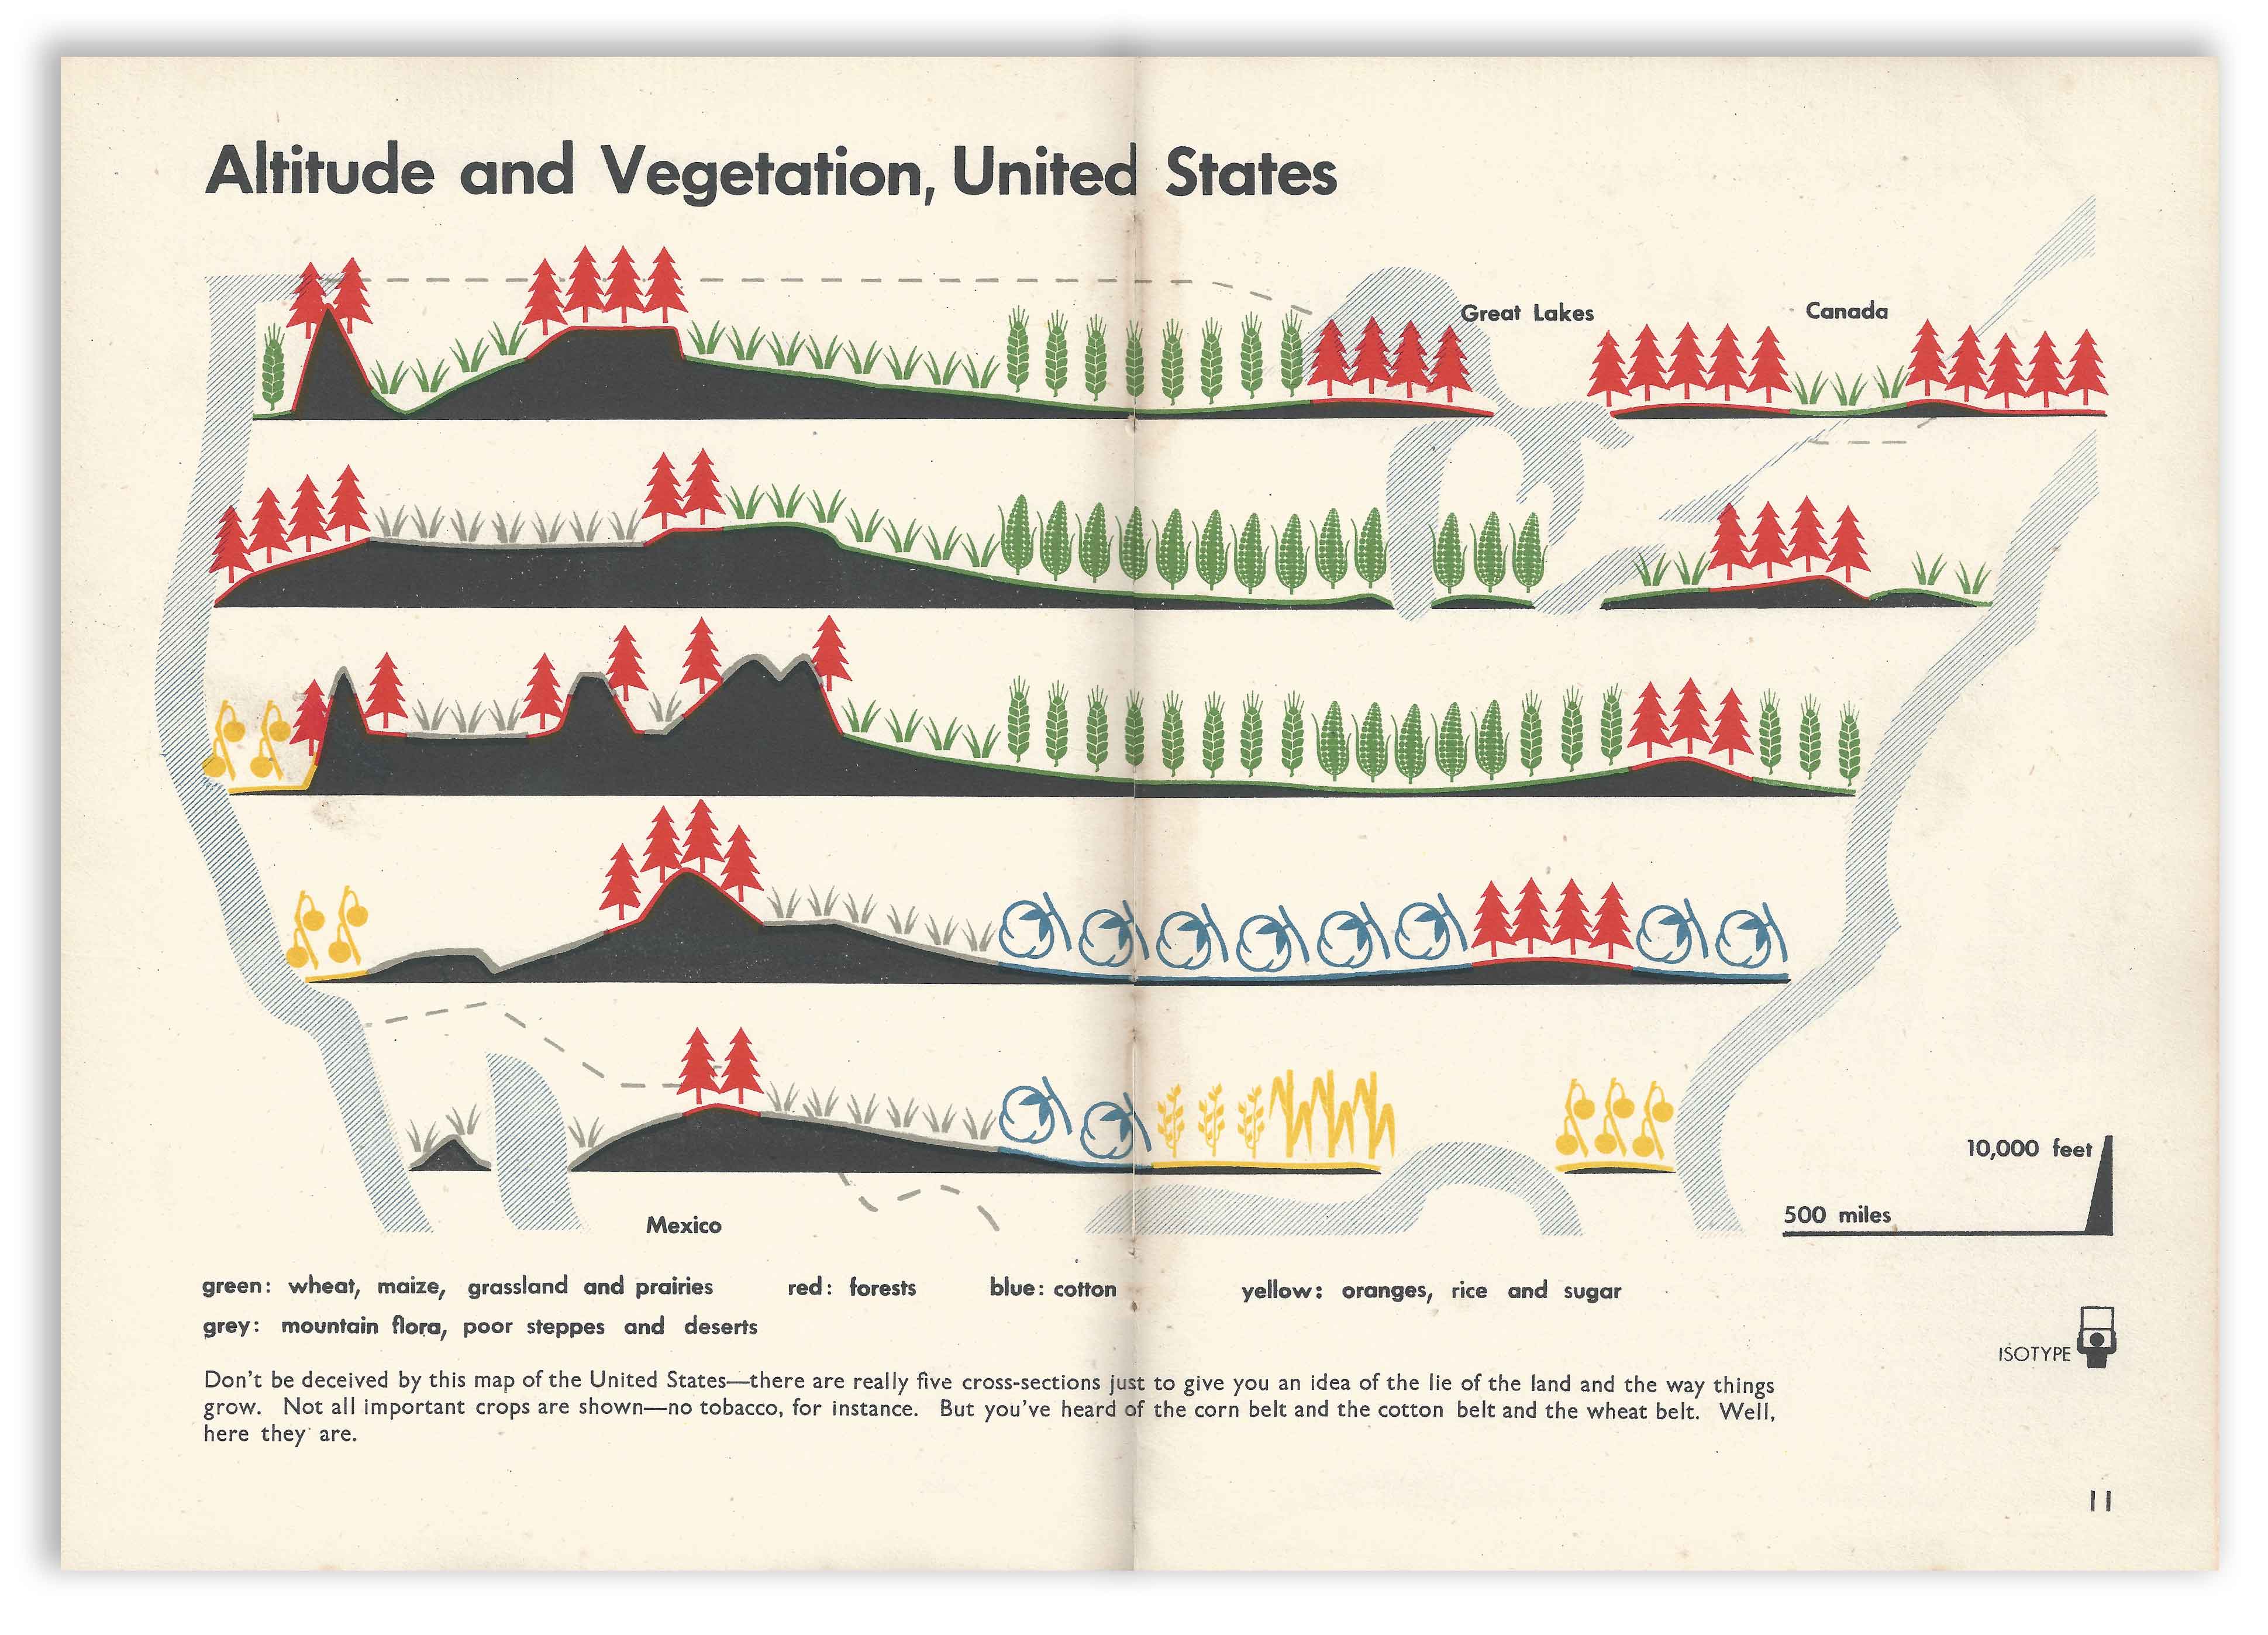
Would like to reproduce an ISOTYPE map/diagram, as resource production was often a theme in these early 20th century designs. Map of Altitude and Vegetation across the United States provides a nice example of the genre.
-
Profiles digitized with LandSerf from a scan of the original.
-
Vegetation and crop symbols created in this SVG editor.
Location of generated files:
path : String -> String
path file =
"https://gicentre.github.io/data/30dayMapChallenge/" ++ fileisotype : Spec
isotype =
let
cfg =
configure
<< configuration (coView [ vicoStroke Nothing ])
profileData =
dataFromUrl (path "isotypeProfiles.csv") [ parse [ ( "x", foNum ), ( "y", foNum ), ( "y2", foNum ) ] ]
pointsData =
dataFromUrl (path "isotypePoints.csv") [ parse [ ( "x", foNum ), ( "y", foNum ) ] ]
coastData =
dataFromUrl (path "isotypeCoast.json") [ topojsonFeature "isotypeCoast" ]
bordersData =
dataFromUrl (path "isotypeBorders.json") [ topojsonFeature "isotypeBorders" ]
labelsData =
dataFromUrl (path "isotypeLabels.csv") [ parse [ ( "x", foNum ), ( "y", foNum ) ] ]
colours =
categoricalDomainMap
[ ( "blue", "rgb(103,137,157)" )
, ( "green", "rgb(115,144,94)" )
, ( "grey", "rgb(156,153,139)" )
, ( "red", "rgb(194,79,70)" )
, ( "yellow", "rgb(237,201,96)" )
]
shapes =
categoricalDomainMap
[ ( "forest", forest )
, ( "grass", grass )
, ( "oranges", oranges )
, ( "sugar", sugar )
, ( "rice", rice )
, ( "wheat", wheat )
, ( "maize", maize )
, ( "cotton", cotton )
]
forest =
"M8 -38 C4 -42 4 -42 0 -48 C-4 -42 -4 -42 -8 -38 L-4 -40 C-6 -34 -6 -34 -10 -28 L-6 -30 C-8 -24 -8 -24 -12 -18 L-8 -20 C-10 -14 -10 -14 -14 -8 L-2 -12 L-2 0 L2 0 L2 -12 L14 -8 C10 -14 10 -14 8 -20 L12 -18 C8 -24 8 -24 6 -30 L10 -28 C6 -34 6 -34 4 -40 Z"
grass =
"M4 0 C4 -4 6 -10 12 -16 C8 -14 6 -12 4 -6 C4 -12 4 -14 8 -20 C4 -16 2 -16 0 0 M-8 -20 C-4 -16 -2 -16 0 0 L-4 0 C-4 -4 -6 -8 -12 -16 C-8 -12 -6 -10 -4 -6 C-4 -12 -4 -14 -8 -20 Z"
oranges =
"M-20 -26 L-18 -20 C-22 -18 -24 -20 -22 -8 C-26 -8 -28 -6 -28 -2 C-28 2 -24 4 -20 4 C-16 4 -14 2 -14 -2 C-14 -2 -14 -8 -20 -8 C-20 -12 -24 -18 -16 -18 L2 4 L2 0 C-6 -10 -26 -20 -12 -38 C-8 -38 -6 -38 -6 -32 C-10 -32 -12 -30 -12 -24 C-12 -20 -10 -18 -4 -18 C0 -18 2 -22 2 -26 C2 -30 -2 -32 -4 -32 C-4 -36 -4 -38 -10 -40 L-8 -42 L-12 -42 Z"
sugar =
"M0 0 L4 0 L4 -4 L12 -22 L18 -6 C16 -24 12 -42 4 -10 L4 -44 L0 -44 L0 -28 C-6 -44 -6 -46 -12 -16 L-6 -34 L0 -20 Z"
rice =
"M0 0 L2 0 L2 -8 C4 -16 10 -16 8 -20 C4 -18 4 -18 4 -14 L2 -10 L2 -22 C6 -26 12 -24 8 -32 C2 -30 6 -28 2 -24 L2 -42 C5 -43 2 -46 6 -48 C8 -44 6 -42 2 -42 L2 -48 L0 -48 L0 -38 C-8 -40 -2 -44 -8 -46 C-12 -40 -2 -38 0 -38 L0 -8 C-4 -8 -14 -12 -4 -16 C-2 -18 -4 -20 -6 -22 C-8 -16 -4 -16 -8 -16 L-10 -22 C-12 -28 -8 -30 -8 -32 C-10 -34 -14 -30 -12 -28 L-14 -28 C-18 -28 -16 -32 -18 -32 C-16 -32 -22 -30 -16 -28 L-12 -26 L-10 -16 C-13 -18 -12 -22 -16 -20 C-15 -19 -14 -16 -12 -18 L-10 -14 C-10 -14 -12 -10 0 -6 Z"
wheat =
"M-0.4 0.7 L-0.4 -3 L2 -3 L2 0.7 M-4 -10 C-6 -12 -8 -17 -0.4 -12 L0.5 -8 M0.5 -13 L-0.4 -17 C-0.4 -19 -9 -25 -5 -16 M0.5 -19 L-0.4 -25 C-5 -27 -8 -27 -5 -22 M-0.7 -26 L-0.4 -31 C-4 -31 -8 -31 -5 -28 M-0.4 -32 L0.3 -37 C-4 -39 -6 -37 -4 -32 M1 -3 C4 -5 8 -5 6 -9 L2 -8 L1 -7 M1 -8 L0.7 -12 C4 -14 9 -17 6 -10 M2 -14 L1 -18 C4 -20 10 -23 6 -16 M1.4 -19.5 L0.6 -25 C1.6 -25 10 -31 6 -22 M0.5 -26 L0.8 -31 C4 -31 9 -36 6 -28 M0.8 -32 L1.6 -37 C5 -39 8 -37 6 -34 M0.7 -38 L-3 -39 C0.8 -45 0.7 -47 5 -39 M-0.09 -7 L0.3 -2 C-2 -5 -6 -4 -5 -8 Z"
maize =
"M-0.4 0.9 L-0.4 -3.1 C19 -12 7.8 -15 16 -26 10 -15 20 -11 2 -3 L2 1 M4 -6 C10 -14 12 -26 7 -46 C8 -32 7 -18 2 -4 M2 -4 C4 -17 6 -24 7 -46 C4 -39 -4 -35 -0.36 -3. M1.5 -4 C-11 -10 -4 -30 -12 -31 C-7 -28 -9 -8 -0.4 -3 M-1 -6 C-4 -20 -3 -32 6 -45 C-6 -34 -9 -21 -2 -7 Z"
cotton =
"M4 -0.9 L-2 0 C16 0 26 -10 10 -28 L10 -28 L12 -30 C16 -28 21 -23 25 -9 L26 -12 C18 -32 16 -32 0 -40 L-4 -40 C-2 -38 2 -38 10 -32 L8 -30 C-4 -44 -30 -14 -2 0 M-8 -27 C-10 -22 -10 -18 -2 -16 C-4 -14 -12 -14 -11 -23 M0.1 -2 C4 -5 5 -4 5 -10 C6 -8 10 -6 4 -2 M-2 -24 C0 -22 4 -22 6 -24 C6 -20 6 -20 8 -14 C10 -17 12 -16 12 -20 C14 -18 20 -10 10 -4 C4 -2 -6 2 -12 -14 C-14 -26 0 -38 6 -28 C4 -28 2 -28 -2 -24 Z"
proj =
projection [ prType identityProjection, prReflectY True ]
coastSpec =
asSpec [ coastData, proj, geoshape [ maColor "rgb(186,206,221)", maOpacity 1 ] ]
bordersSpec =
asSpec
[ bordersData
, proj
, geoshape
[ maFilled False
, maStrokeWidth 2
, maStrokeDash [ 8, 8 ]
, maStroke "rgb(166,159,147)"
]
]
profileBodyEnc =
encoding
<< position X
[ pName "x"
, pScale [ scDomain (doNums [ 0, 3400 ]), scNice niFalse ]
, pQuant
, pAxis []
]
<< position Y
[ pName "y"
, pScale [ scDomain (doNums [ 0, 1735 ]), scNice niFalse ]
, pQuant
, pAxis []
]
<< position Y2 [ pName "y2" ]
<< detail [ dName "profile", dNominal ]
profileBodySpec =
asSpec
[ profileData
, profileBodyEnc []
, area
[ maInterpolate miMonotone
, maColor "rgb(70,70,70)"
, maStroke "rgb(70,70,70)"
, maStrokeWidth 3
]
]
transSurface =
transform
<< calculateAs "datum.y + 0.5" "surfY"
profileSurfaceEnc =
encoding
<< position X [ pName "x", pQuant, pAxis [] ]
<< position Y [ pName "surfY", pQuant, pAxis [] ]
<< detail [ dName "colourProfile", dNominal ]
<< color [ mName "colour", mNominal, mScale colours, mLegend [] ]
profileSurfaceSpec =
asSpec
[ profileData
, profileSurfaceEnc []
, transSurface []
, line [ maInterpolate miMonotone, maStrokeWidth 3 ]
]
labelsEnc =
encoding
<< position X [ pName "x", pQuant, pAxis [] ]
<< position Y [ pName "y", pQuant, pAxis [] ]
<< text [ tName "label", tNominal ]
labelsSpec =
asSpec
[ labelsData
, labelsEnc []
, textMark
[ maColor "rgb(70,70,70)"
, maAlign haLeft
, maFont "Futura"
, maFontWeight Bold
, maFontSize 12
]
]
pointsEnc =
encoding
<< position X [ pName "x", pQuant, pAxis [] ]
<< position Y [ pName "y", pQuant, pAxis [] ]
<< color [ mName "colour", mNominal, mScale colours, mLegend [] ]
<< shape [ mName "type", mNominal, mScale shapes, mLegend [] ]
pointsSpec =
asSpec
[ pointsData
, pointsEnc []
, point
[ maFilled True
, maStrokeWidth 0.5
, maOpacity 1
, maSize 1.7
]
]
mapSpec =
asSpec
[ width 900
, height 450
, layer
[ bordersSpec
, profileBodySpec
, profileSurfaceSpec
, coastSpec
, pointsSpec
, labelsSpec
]
]
textData =
dataFromColumns []
<< dataColumn "x" (nums [ 100, 1100, 1500, 1900, 100, 100, 100, 100 ])
<< dataColumn "y" (nums [ 100, 100, 100, 100, 90, 70, 60, 50 ])
<< dataColumn "weight" (strs [ "b", "b", "b", "b", "b", "n", "n", "n" ])
<< dataColumn "label"
(strs
[ "green: wheat, maize, grassland and praries"
, " red: forests"
, "blue: cotton"
, "yellow: oranges, rice and sugar"
, "grey: mountain flora, poor steppes and deserts"
, "Don't be deceived by this map of the United States——there are really five cross-sections just to give you an idea of the lie of the land and the way"
, "things grow. Not all important crops are shown——no tobacco, for instance. But you've heard of the corn belt and the cotton belt and the wheat belt."
, "Well, here they are."
]
)
textEnc =
encoding
<< position X
[ pName "x"
, pQuant
, pScale [ scDomain (doNums [ 0, 3400 ]), scNice niFalse ]
, pAxis []
]
<< position Y
[ pName "y"
, pQuant
, pScale [ scZero False, scNice niFalse ]
, pAxis []
]
<< text [ tName "label", tNominal ]
<< color [ mDataCondition [ ( expr "datum.weight == 'b'", [ mStr "black" ] ) ] [ mStr "#666" ] ]
textSpec =
asSpec
[ width 900
, height 90
, textData []
, textEnc []
, textMark [ maAlign haLeft, maFont "Futura" ]
]
in
toVegaLite
[ cfg []
, padding (paSize 30)
, background "rgb(252,246,230)"
, title "Altitude and Vegetation, United States"
[ tiFont "Futura"
, tiFontSize 26
, tiColor "rgb(70,70,70)"
, tiAnchor anStart
, tiOffset 10
]
, vConcat [ mapSpec, textSpec ]
]