Skip to content
New issue

Have a question about this project? Sign up for a free GitHub account to open an issue and contact its maintainers and the community.

By clicking “Sign up for GitHub”, you agree to our terms of service and privacy statement. We’ll occasionally send you account related emails.

Already on GitHub? Sign in to your account

Huge memory usage by retention policy #10453

Closed
aslobodskoy-fiksu opened this issue Nov 5, 2018 · 16 comments
Closed

Huge memory usage by retention policy #10453

aslobodskoy-fiksu opened this issue Nov 5, 2018 · 16 comments

Comments

@aslobodskoy-fiksu
Copy link

System info: Official docker image 1.6.4-alpine

Steps to reproduce:

  1. Run retention on huge DB
  2. Check Memory consumption

Actual behavior: Huge memory consumption
Additional info:
image
PS
With 1.6.3 we got little bit another behaviour. Once per week (shard group duration 7 days) it was running extremely long(2-3 hours), continuously consume memory and crashes because of OOM.

@e-dard
Copy link
Contributor

e-dard commented Nov 15, 2018

@aslobodskoy-fiksu which index are you using? inmem or tsi1? If you're using inmem I recommend you upgrade to tsi1 and then see how your heap looks. Removing shards with tsi1 is much cheaper.

@aslobodskoy-fiksu
Copy link
Author

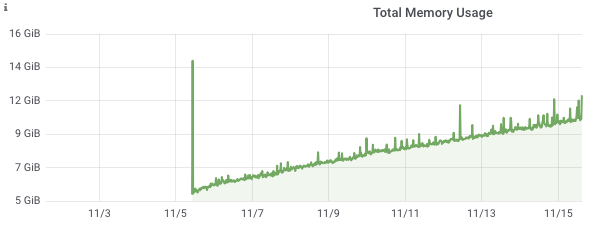
@e-dard I don't see such huge spikes anymore but overall memory consumption doesn't look great.
image
I'm going to try tsi1

@aslobodskoy-fiksu
Copy link
Author

I've switched influxdb to tsi1. The spikes are not so high but general trend of memory consumption doesn't look fine
image

@dgnorton dgnorton added the 1.x label Jan 7, 2019
@persberry
Copy link

Hi,

I tried to troubleshoot the same issue with retention policy. I switched to tsi1 (removed everything from the db before that) and now have very similar simptoms, memory usage is increasing.

I'll be very grateful for any relevant suggestion.

Influxdb 1.7.3 is running in docker swarm, as a service. Data is stored on aws ebs gp2 volume.
Unix RSS typically looks like that (taken from /sys/fs/cgroup/memory/memory.stat):
influx_mem
At the time when RSS=3.2GB,

pprof:
Count Profile
3196 allocs
43 block
0 cmdline
64 goroutine
3196 heap
35 mutex
0 profile
15 threadcreate
0 trace
Heap and allocs are always increasing.

pprof heap top:
Showing nodes accounting for 1202.09MB, 97.66% of 1230.92MB total
Dropped 76 nodes (cum <= 6.15MB)
Showing top 10 nodes out of 66
flat flat% sum% cum cum%
937.03MB 76.12% 76.12% 937.03MB 76.12% github.com/influxdata/influxdb/pkg/pool.(*LimitedBytes).Get
54.05MB 4.39% 80.52% 54.05MB 4.39% github.com/influxdata/influxdb/pkg/rhh.assign
48.19MB 3.91% 84.43% 48.19MB 3.91% bytes.makeSlice
40.45MB 3.29% 87.72% 58.95MB 4.79% github.com/influxdata/influxdb/tsdb/index/tsi1.(*LogFile).execSeriesEntry
40.33MB 3.28% 90.99% 66.11MB 5.37% github.com/influxdata/influxdb/tsdb/engine/tsm1.(*partition).write
Note: the (*LimitedBytes).Get always increases.

pprof allocs top:
Showing nodes accounting for 157.39GB, 83.99% of 187.39GB total
Dropped 700 nodes (cum <= 0.94GB)
Showing top 10 nodes out of 84
flat flat% sum% cum cum%
56.02GB 29.90% 29.90% 56.02GB 29.90% bytes.makeSlice
24.58GB 13.12% 43.01% 64.33GB 34.33% github.com/influxdata/influxdb/tsdb/engine/tsm1.(*Engine).WritePoints
17.46GB 9.32% 52.33% 19.04GB 10.16% github.com/influxdata/influxdb/tsdb/engine/tsm1.(*partition).write
16.97GB 9.06% 61.39% 36.01GB 19.22% github.com/influxdata/influxdb/tsdb/engine/tsm1.(*Cache).WriteMulti
15.87GB 8.47% 69.86% 15.87GB 8.47% github.com/influxdata/influxdb/tsdb/engine/tsm1.(*partition).keys
15.45GB 8.25% 78.11% 15.45GB 8.25% github.com/influxdata/influxdb/tsdb/engine/tsm1.(*ring).apply.func1

Logs are all the same:
lvl=info msg="Cache snapshot (end)" log_id=0DA_XgDG000 engine=tsm1 trace_id=0DAhDdJW000 op_name=tsm1_cache_snapshot op_event=end op_elapsed=292.107ms
lvl=info msg="Snapshot for path written" log_id=0DA_XgDG000 engine=tsm1 trace_id=0DAhDdJW000 op_name=tsm1_cache_snapshot path=/var/lib/influxdb/data/db/db_ret_policy/3 duration=292.083ms
vl=info msg="Removing WAL file" log_id=0DA_XgDG000 engine=tsm1 service=wal path=/var/lib/influxdb/wal/db/db_ret_policy/3/_18950.wal
lvl=info msg="Snapshot for path deduplicated" log_id=0DA_XgDG000 engine=tsm1 path=/var/lib/influxdb/data/db/db_ret_policy/3 duration=28.453ms

Looks like the issue is in func (p *LimitedBytes) Get(sz int) which makes no sence as it's a part of utility package.

@stale
Copy link

stale bot commented Jul 23, 2019

This issue has been automatically marked as stale because it has not had recent activity. It will be closed if no further activity occurs. Thank you for your contributions.

@stale stale bot added the wontfix label Jul 23, 2019
@stale
Copy link

stale bot commented Jul 30, 2019

This issue has been automatically closed because it has not had recent activity. Please reopen if this issue is still important to you. Thank you for your contributions.

@stale stale bot closed this as completed Jul 30, 2019
@Dileep-Dora
Copy link

Is this issue got fixed?
We're facing issues with influx 1.7.2 version where retention check interval is 30 minutes. After staging 30 minutes memory is going high and influx dying because of OOM.
Screenshot 2019-09-25 at 5 18 51 PM

Total memory is 30GB.

@e-dard
Copy link
Contributor

e-dard commented Sep 25, 2019

@Dileep-Dora my suspicion there is that you're running the inmem (default) index. In that case when a shard is dropped off the index needs to be interrogated for things that might need to be removed. It could be causing your heap issue. If your cardinality is high (in the millions) consider converting to the TSI index, which will make dropping off shards much cheaper.

@lobocobra
Copy link

lobocobra commented Nov 11, 2019

Influxdb is crashing my VMM server every 6h - 24h. I suspected that memory runs out and this seems to be the case. This problem happens since I had the bad idea to upgrade to v1.7.x, the more I upgrade the less longer it works.

So I changed the config file from TSM to TSI started following command...

  1. shutdown influxdb
  2. sudo -H -u influxdb bash -c influx_inspect buildtsi -datadir /var/lib/influxdb/data -waldir /var/lib/influxdb/wal
    .... btw above command has the right quotes like $()

After 5h not one single index folder was created... I checked it by...
find /var/lib/influxdb -type d -name index
=> NOTHING found
I just wanted to have an alternative to RRD that works, but I have now an unstable homeautomation due to influxdb.
=> Anyone has a hint ? Should I downgrade to 1.64? if yes HOW?
=> Should I increase SHRED? if yes HOW?
=> Should I move from TSM to TSI? .... well guess... HOW?

I know you guys put a lot of effort in this DB, but I want to avoid to become an influxDB expert, before it works without OOM

@e-dard
Copy link
Contributor

e-dard commented Nov 12, 2019

@lobocobra sorry to hear you're having problems. Those sorts of questions seem like they would be better answered on the community forum, rather than the issue tracker. https://community.influxdata.com/

@lobocobra
Copy link

lobocobra commented Nov 12, 2019

thanks for the response. I understand....
.... but looking at the numbers of persons that report a OOM situation I wonder if this is not a bug?

I isolated the issue by moving influxdb to a new virtual server... guess what server crashed after a while.

In 1.6.4 I had never such problems. I guess I have simply to find out how to downgrade influxdb and then I will wait until the bug was found and solved, before I upgrade again.
A software that increases memory usage to the point that the underlying system is crashing, has in my humble opinion a bug. And I see little chance to have a bug solved in a community.

Some examples...
#10468
=> He deleted the data... well not really a solution and a 2nd guy just doubled he has the same issue
https://community.influxdata.com/t/memory-leak-in-influxdb-1-7-4/8889
=> also an VM ....
https://community.influxdata.com/t/memory-increase-slowly-over-17-hours-until-oom-killed-it/3893
...
Some could think... yea not the latest version... but I have the latest and still have the issue. :(

@positron96
Copy link

@lobocobra
There are some instructions for downgrading from 1.7, it doesn't look very difficult: https://docs.influxdata.com/influxdb/v1.7/administration/upgrading/, it just tells you to delete tsi indexes and turn on inmem index in config.
I'm also somewhat struggling with my pet influxdb's increased memory consumption and disk io spikes (which I upgraded from 1.6 to 1.7.9 on a 512Mb cloud server), will try downgrading soon if it continues to be the case.

@Doc999tor
Copy link

@lobocobra @positron96
Any updates regarding the downgrade?
I'm on 1.7.4 and hit the 800M for influxdb, considering to try downgrading as well

@positron96
Copy link

positron96 commented Dec 30, 2019

@lobocobra @positron96
Any updates regarding the downgrade?
I'm on 1.7.4 and hit the 800M for influxdb, considering to try downgrading as well

Well, I downgraded to 1.7.1 and disabled TSI, it already helped remove disk usage spikes and RAM consumption is some 50-80 mb less (quite a lot on 512 mb server).
I might downgrade further to 1.6, but not in the near future, since my immediate problems are currently solved.

Here is transition from 1.7.9 to 1.7.1 and disabling TSI:
image

@lobocobra
Copy link

lobocobra commented Jan 11, 2020

@positron96
Many thanks for your feed-back. After my server froze again, I do now an attempt to go back to version 1.6.4.
I am surprized, that this bug is not fixed. How a package can regularily crash the underlying server, without this is fixed? I would expect that the sw recognizes such situations before it happens and either shut-down or restarts.

Here are the steps I did to downgrade, it might help others:
wget https://dl.influxdata.com/influxdb/releases/influxdb_1.6.4_amd64.deb
sudo dpkg -i influxdb_1.6.4_amd64.deb

Here how to re-index.... (only neded for ts1)
https://community.hiveeyes.org/t/repair-influxdb-tsi-index-files/1107

Memory usage went down from 1.1GB to 340 MB.

@horsto
Copy link

horsto commented Feb 27, 2023

Is this still an issue for people? My influx db memory usage increases steadily over the course of 72h (approx.) until it basically incapacitates the server it is running on. I wonder if there is a more recent fix for this?

Sign up for free to join this conversation on GitHub. Already have an account? Sign in to comment
Projects
None yet
Development

No branches or pull requests

9 participants