Skip to content
New issue

Have a question about this project? Sign up for a free GitHub account to open an issue and contact its maintainers and the community.

By clicking “Sign up for GitHub”, you agree to our terms of service and privacy statement. We’ll occasionally send you account related emails.

Already on GitHub? Sign in to your account

Live metrics support #62

Closed
twitchax opened this issue Aug 30, 2023 · 21 comments
Closed

Live metrics support #62

twitchax opened this issue Aug 30, 2023 · 21 comments

Comments

@twitchax
Copy link
Contributor

No description provided.

@frigus02
Copy link
Owner

I haven't tried, but I don't think it's supported.

We're talking about this, right?

https://learn.microsoft.com/en-us/azure/azure-monitor/app/live-stream?tabs=dotnet6

I'd definitely like to explore if this is possible using open telemetry.

@twitchax
Copy link
Contributor Author

Yes, that. I tried just pushing some random metrics, and they shoed up in the Metrics tab, but not in the Live Metrics area. May need to look at the .NET library to see how it gets enabled?

@twitchax
Copy link
Contributor Author

Yeah, it has its own special counters, and endpoints. Likely possible, but also likely a lot of work.

@twitchax
Copy link
Contributor Author

twitchax commented Aug 30, 2023

Just curious, what are you using App Insights for? A website? What framework?

I am working on a library to leverage your library and tracing to get axum=> app insights integration up really quickly.

It would look something like this to get the layer, and then you just pass the layer into axum.

let telemetry_layer = AppInsights::default()
    .with_connection_string(config.analytics_api_key.clone())
    .with_service_config("rtz", name)
    .with_catch_panic(true)
    .with_field_mapper(|p| {
        let fly_alloc_id = FLY_ALLOC_ID.get().unwrap().to_owned();
        let fly_public_ip = FLY_PUBLIC_IP.get().unwrap().to_owned();
        let fly_region = FLY_REGION.get().unwrap().to_owned();
        let fly_accept_region = p.headers.get("Fly-Region").map(|v| v.to_str().unwrap_or("unknown").to_owned()).unwrap_or("unknown".to_owned());

        HashMap::from([
            ("fly.alloc_id".to_string(), fly_alloc_id),
            ("fly.public_ip".to_string(), fly_public_ip),
            ("fly.server_region".to_string(), fly_region),
            ("fly.accept_region".to_string(), fly_accept_region),
        ])
    })
    .with_panic_mapper(|e| {
        (500, WebError {
            status: 500,
            message: format!("A panic occurred: {:?}", e),
            backtrace: None,
        })
    })
    .with_error_type::<WebError>()
    .build_and_set_global_default()
    .unwrap()
    .layer();

@frigus02
Copy link
Owner

Yeah, it has its own special counters, and endpoints. Likely possible, but also likely a lot of work.

Good find. I might give this a go on the weekend. Though, yeah. This might be a bit of work.

Just curious, what are you using App Insights for? A website? What framework?

I created this crate when I was working on a website. We used tide, if I remember correctly. I'm not working on that anymore and have currently no personal use for opentelemetry-application-insights. I still enjoy maintaining it, though.

I am working on a library to leverage your library and tracing to get axum=> app insights integration up really quickly.

It would look something like this to get the layer, and then you just pass the layer into axum.

This looks really nice and easy to setup. I like it. And I can see how live metrics would be useful for this.

@twitchax
Copy link
Contributor Author

Yeah, let me know if I can help out with the live metrics. Just released the library here: https://github.com/twitchax/axum-insights.

@frigus02 frigus02 mentioned this issue Sep 3, 2023
@frigus02 frigus02 changed the title Does the new metrics integration support live metrics? Live metrics support Sep 3, 2023
@frigus02
Copy link
Owner

frigus02 commented Sep 3, 2023

I played around with this today. The experiment is working: #63 🎉

I do wonder a bit if this belongs in this crate. I don't think it can use much of the OpenTelemetry SDK to make this work. It seems like almost an entirely different thing. Though it would be weird if you had to install 2 metric collecting crates. So maybe it should go in here?

@twitchax
Copy link
Contributor Author

twitchax commented Sep 4, 2023

Whoa, that's awesome; I think it would fit well here, but that's just my opinion. :)

@frigus02
Copy link
Owner

frigus02 commented Sep 4, 2023

I gave it a bit more thought and I think I agree now.

I need to read more, but it seems live metrics may also include traces. Having it in this crate might make it easier to automatically include relevant traces.

@twitchax
Copy link
Contributor Author

twitchax commented Sep 5, 2023

Yeah, it would be cool if request traces, failed requests, exception events, db.statement traces, etc. all just went straight to live metrics. :)

@twitchax
Copy link
Contributor Author

twitchax commented Sep 5, 2023

Let me know if I can help out at all. 😄

@frigus02
Copy link
Owner

frigus02 commented Sep 5, 2023

I'm likely not going to do any work on this until the weekend. As far as I can tell, we need to:

  • Find a way to access tracing spans in the live metrics. I think we probably need to register a 2nd SpanProcessor, so that we see spans as soon as they're done.
  • Use these spans to calculate the standard live metrics: request rates, dependency rates, error rates.
    • only collect metrics when collection is enabled
  • If we want to include CPU and memory metrics, we also need to collect those.
  • Collect documents
  • Respect quota? The .NET implementation has something about quota returned by the endpoint
  • At the moment the loop always waits 1sec and then checks the current time (
    let ticker = runtime.interval(TICK_INTERVAL).map(|_| Message::Tick);
    ). I'd kinda like to wait for the calculated timeout (
    let mut current_timeout = if is_collecting {
    POST_INTERVAL
    } else {
    polling_interval_hint.unwrap_or(PING_INTERVAL)
    };
    if !last_send_succeeded {
    let time_since_last_success = now
    .duration_since(last_success_time)
    .unwrap_or(Duration::MAX);
    if is_collecting && time_since_last_success >= MAX_POST_WAIT_TIME {
    // Haven't posted successfully in 20 seconds, so wait 60 seconds and ping
    is_collecting = false;
    current_timeout = FALLBACK_INTERVAL;
    } else if !is_collecting && time_since_last_success >= MAX_PING_WAIT_TIME {
    // Haven't pinged successfully in 60 seconds, so wait another 60 seconds
    current_timeout = FALLBACK_INTERVAL;
    }
    }
    println!("[QPS] Next in {:?}", current_timeout);
    next_action_time = now + current_timeout;
    ) instead. That's a minor thing, though. Might not matter much.
  • Expose some configuration option, at least to enable/disable live metrics, on the pipeline builder and/or exporter.

Feel free to work on any one of those things if you have time. I can merge that with what I have when I find the time.

@twitchax
Copy link
Contributor Author

twitchax commented Sep 6, 2023

Sounds good. I will be freed up more next week. Likely best area for me would be configuration options.

Aren't you already doing the CPU / memory piece?

@frigus02
Copy link
Owner

frigus02 commented Sep 9, 2023

Aren't you already doing the CPU / memory piece?

Yeah, I added CPU metrics. But they are incomplete and I'm not sure they're correct, either. Definitely needs a second look.

@frigus02
Copy link
Owner

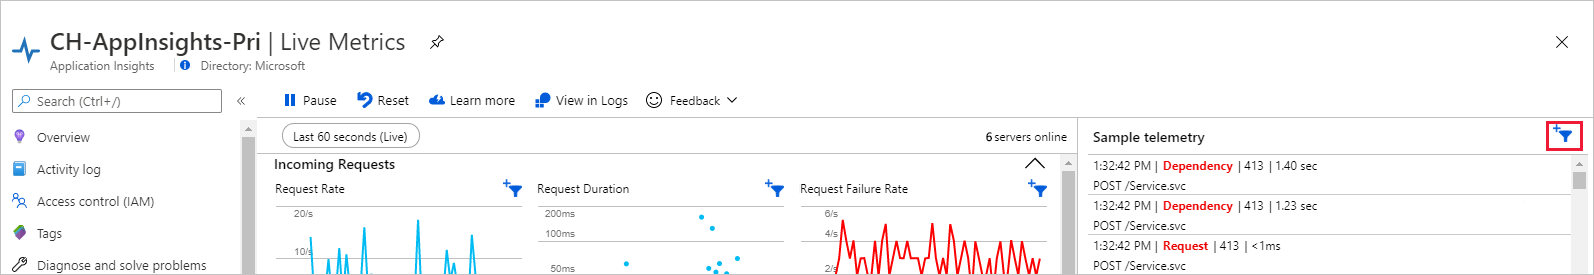
Made some good progress. But interestingly documents don't want to work. The Portal says "Not supported by this Agent/SDK version" in the "Sample telemetry" panel. I wonder if it detects that based on the SDK version included in the request. I tried faking the Node.js SDK by sending the same value, but it didn't work. This needs some more investigation.

@twitchax
Copy link
Contributor Author

Very cool! What do you mean by documents?

@frigus02
Copy link
Owner

Hi. Quick update: I haven't found any time to work on this recently but I think I should find time again next weekend.

With "documents" I meant the sample telemetry panel on the right side as in https://learn.microsoft.com/de-de/azure/azure-monitor/app/media/live-stream/filter.png.

My plan for now is to finish live metrics without sample telemetry and release that. We can always add sample telemetry later.

@twitchax
Copy link
Contributor Author

twitchax commented Oct 15, 2023 via email

@frigus02
Copy link
Owner

Released with version 0.28.0.

The PR #63 shows an updated screenshot for how that look like for me now. It also includes a new example.

Let me know if this does/doesn't work for you. I'm pretty sure lots can be improved. But this seems like a good start. Thanks for suggesting that.

@twitchax
Copy link
Contributor Author

Ha, awesome!

Integrated into axum-insights, and then into rtz, and it appears to work perfectly. Awesome work!

Sign up for free to join this conversation on GitHub. Already have an account? Sign in to comment
Labels
None yet
Projects
None yet
Development

No branches or pull requests

2 participants