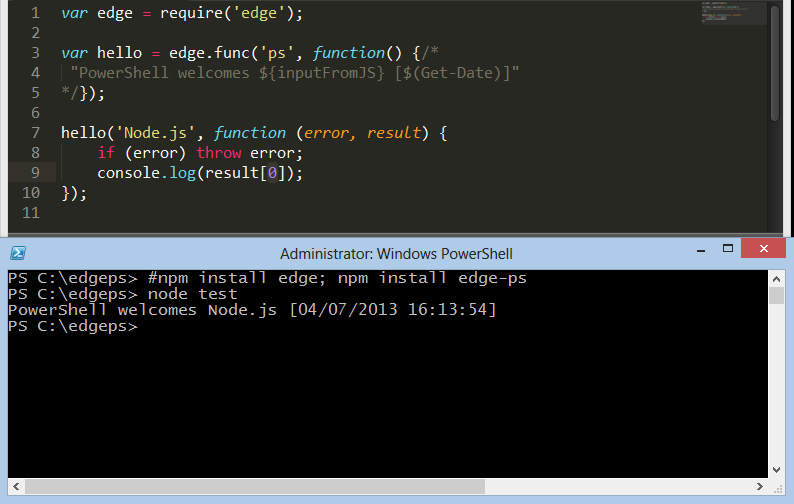
This is a PowerShell compiler for edge.js.
- Windows
- node.js 0.6.x or later (developed and tested with v0.6.20, v0.8.22, and v0.10.0, both x32 and x64 architectures)
- edge.js See the Edge.js overview.
npm install edge
- edge-ps
npm install edge-ps
- .NET 4.5
- PowerShell
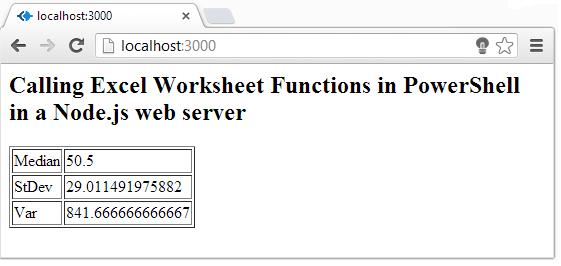
Here from a Node.js web server app we can call PowerShell which fires up Excel. From PowerShell we access Excel Worksheet Functions and at the end, return a simple html table with the results.
var ps=edge.func('ps', function(){/*

    param($data=1..100)

    $xl = New-Object -ComObject Excel.Application
    $xlProcess = Get-Process excel
    $wf = $xl.WorksheetFunction

    #$data = $data | Invoke-Expression

    $r = New-Object PSObject -Property @{
        Median = $wf.Median($data)
        StDev  = $wf.StDev($data)
        Var    = $wf.Var($data)
    }

    $xlProcess.kill()

@"
    <h2>Calling Excel Worksheet Functions in PowerShell in a Node.js web server</h2>
    <table border='1'>
    <tr><td>Median</td><td>$($r.Median)</td></tr>
    <tr><td>StDev</td><td>$($r.StDev)</td></tr>
    <tr><td>Var</td><td>$($r.Var)</td></tr>
    </table>
"@

*/})var ps=edge.func('ps', function(){/*
$dataset = Get-Process |
Sort handles -desc |
Select -first 10 name, company, handles |
ConvertTo-Json -Compress
@"
<html lang="en">
<head>
<meta charset="utf-8">
<title>Top 10 Process with most handles</title>
<script type="text/javascript" src="js/d3.v3.js"></script>
<link rel="stylesheet" type="text/css" href="css/chart.css" />
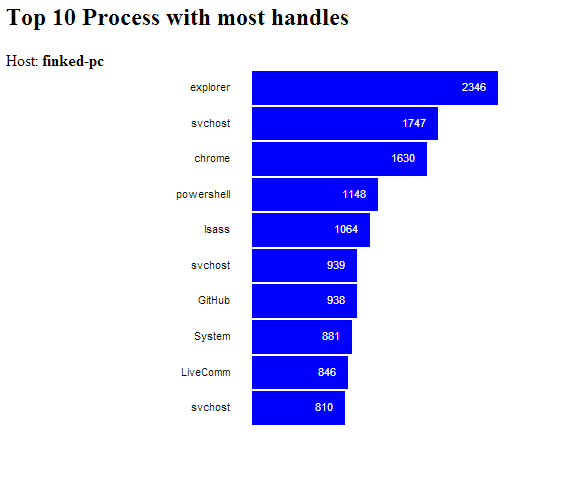
<h2>Top 10 Process with most handles</h2>
<span>Host: </span><span><b>$(hostname)</span>
</head>
<body>
<script type="text/javascript">
var dataset = $dataset;
d3.select("body")
.append("div")
.attr("class","chart")
.selectAll("div.line")
.data(dataset)
.enter()
.append("div")
.attr("class","line")
d3.selectAll("div.line")
.append("div")
.attr("class","label")
.text(function(data) { return data.Name })
d3.selectAll("div.line")
.append("div")
.attr("class","bar")
.style("width", function(d){ return d.Handles/10 + "px" })
.text(function(d){ return d.Handles });
</script>
</body>
</html>
"@
*/})See edge.js overview and edge.js on GitHub for more information.


