Dashboard
The Hystrix Dashboard enables realtime monitoring of Hystrix metrics.
Use of this dashboard improved Netflix operations by reducing discovery and recovery times during operational events. The duration of most production incidents (already less frequent due to Hystrix) became far shorter, with diminished impact, due to the realtime insights into system behavior.
 (Click for larger view.)
When a circuit is failing then it changes colors (gradient from green through yellow, orange and red) such as this:

The diagram below shows one "circuit" from the dashboard along with explanations of what all of the data represents.
We've purposefully tried to pack a lot of information into the dashboard so that engineers can quickly consume and correlate data.

It allows monitoring a single server or a cluster of servers aggregated using Turbine with low latency (typically around 1 or 2 seconds when aggregating a cluster, subsecond with a single server).

Here is another example from the Netflix API dashboard monitoring 476 servers aggregated using Turbine:
 (Click for larger view.)
- Download hystrix-dashboard-1.1.1.war
- Install in servlet container such as Apache Tomcat 7
Usage examples below will assume installation to /webapps/hystrix-dashboard.war
./gradlew build
cp hystrix-dashboard/build/libs/hystrix-dashboard-*.war ./apache-tomcat-7.*/webapps/hystrix-dashboard.war  (or other servlet container)
The hystrix-metrics-event-stream module exposes metrics in a text/event-stream formatted stream that continues as long as a client holds the connection.
Each HystrixCommand instance will emit data such as this (without line breaks):
data: {
  "type": "HystrixCommand",
  "name": "PlaylistGet",
  "group": "PlaylistGet",
  "currentTime": 1355239617628,
  "isCircuitBreakerOpen": false,
  "errorPercentage": 0,
  "errorCount": 0,
  "requestCount": 121,
  "rollingCountCollapsedRequests": 0,
  "rollingCountExceptionsThrown": 0,
  "rollingCountFailure": 0,
  "rollingCountFallbackFailure": 0,
  "rollingCountFallbackRejection": 0,
  "rollingCountFallbackSuccess": 0,
  "rollingCountResponsesFromCache": 69,
  "rollingCountSemaphoreRejected": 0,
  "rollingCountShortCircuited": 0,
  "rollingCountSuccess": 121,
  "rollingCountThreadPoolRejected": 0,
  "rollingCountTimeout": 0,
  "currentConcurrentExecutionCount": 0,
  "latencyExecute_mean": 13,
  "latencyExecute": {
    "0": 3,
    "25": 6,
    "50": 8,
    "75": 14,
    "90": 26,
    "95": 37,
    "99": 75,
    "99.5": 92,
    "100": 252
  },
  "latencyTotal_mean": 15,
  "latencyTotal": {
    "0": 3,
    "25": 7,
    "50": 10,
    "75": 18,
    "90": 32,
    "95": 43,
    "99": 88,
    "99.5": 160,
    "100": 253
  },
  "propertyValue_circuitBreakerRequestVolumeThreshold": 20,
  "propertyValue_circuitBreakerSleepWindowInMilliseconds": 5000,
  "propertyValue_circuitBreakerErrorThresholdPercentage": 50,
  "propertyValue_circuitBreakerForceOpen": false,
  "propertyValue_circuitBreakerForceClosed": false,
  "propertyValue_circuitBreakerEnabled": true,
  "propertyValue_executionIsolationStrategy": "THREAD",
  "propertyValue_executionIsolationThreadTimeoutInMilliseconds": 800,
  "propertyValue_executionIsolationThreadInterruptOnTimeout": true,
  "propertyValue_executionIsolationThreadPoolKeyOverride": null,
  "propertyValue_executionIsolationSemaphoreMaxConcurrentRequests": 20,
  "propertyValue_fallbackIsolationSemaphoreMaxConcurrentRequests": 10,
  "propertyValue_metricsRollingStatisticalWindowInMilliseconds": 10000,
  "propertyValue_requestCacheEnabled": true,
  "propertyValue_requestLogEnabled": true,
  "reportingHosts": 1
}
The Hystrix Dashboard expects data in the format that this module emits.
See its README for installation instructions.
- Download turbine-web-1.0.0.war
- Install in servlet container such as Apache Tomcat 7
Usage examples below will assume installation to /webapps/turbine.war
git clone git://github.com/Netflix/Turbine.git
./gradlew build
cp turbine-web/build/libs/turbine-web-*.war ./apache-tomcat-7.*/webapps/turbine.war  (or other servlet container)
Turbine configuration details can be found on its Configuration Wiki. It also supports custom plugins for Instance Discovery.
To get started as a "Hello World!" example a static configuration file pointing to specific instances can be used such as the following.
Create a file config.properties that lists hosts to aggregate.
This example includes 2 EC2 instances:
turbine.ConfigPropertyBasedDiscovery.default.instances=ec2-72-44-38-203.compute-1.amazonaws.com,ec2-23-20-84-255.compute-1.amazonaws.com
turbine.instanceUrlSuffix=:8080/hystrix.stream
The 'turbine.instanceUrlSuffix' property is what will be appended to each hostname to create a URL that will result in the hystrix-metrics-event-stream.
The config.properties file can be:
- placed on the classpath such as in /WEB-INF/classes
- specified using a JVM property such as
-Darchaius.configurationSource.additionalUrls=file:///path/to/config.properties
You can test that Turbine is correctly accessing instances and streaming metrics like this:
curl http://hostname:port/turbine/turbine.stream
If successful you should see something like this:
$ curl http://ec2-23-20-84-255.compute-1.amazonaws.com:8080/turbine/turbine.stream
: ping
data: {"rollingCountFailure":0,"propertyValue_executionIsolationThreadInterruptOnTimeout":true,"rollingCountTimeout":0,"rollingCountExceptionsThrown":0,"rollingCountFallbackSuccess":0,"errorCount":0,"type":"HystrixCommand","propertyValue_circuitBreakerEnabled":true,"reportingHosts":1,"latencyTotal":{"0":0,"95":0,"99.5":0,"90":0,"25":0,"99":0,"75":0,"100":0,"50":0},"currentConcurrentExecutionCount":0,"rollingCountSemaphoreRejected":0,"rollingCountFallbackRejection":0,"rollingCountShortCircuited":0,"rollingCountResponsesFromCache":0,"propertyValue_circuitBreakerForceClosed":false,"name":"IdentityCookieAuthSwitchProfile","propertyValue_executionIsolationThreadPoolKeyOverride":"null","rollingCountSuccess":0,"propertyValue_requestLogEnabled":true,"requestCount":0,"rollingCountCollapsedRequests":0,"errorPercentage":0,"propertyValue_circuitBreakerSleepWindowInMilliseconds":5000,"latencyTotal_mean":0,"propertyValue_circuitBreakerForceOpen":false,"propertyValue_circuitBreakerRequestVolumeThreshold":20,"propertyValue_circuitBreakerErrorThresholdPercentage":50,"propertyValue_executionIsolationStrategy":"THREAD","rollingCountFallbackFailure":0,"isCircuitBreakerOpen":false,"propertyValue_executionIsolationSemaphoreMaxConcurrentRequests":20,"propertyValue_executionIsolationThreadTimeoutInMilliseconds":1000,"propertyValue_metricsRollingStatisticalWindowInMilliseconds":10000,"propertyValue_fallbackIsolationSemaphoreMaxConcurrentRequests":10,"latencyExecute":{"0":0,"95":0,"99.5":0,"90":0,"25":0,"99":0,"75":0,"100":0,"50":0},"group":"IDENTITY","latencyExecute_mean":0,"propertyValue_requestCacheEnabled":true,"rollingCountThreadPoolRejected":0}
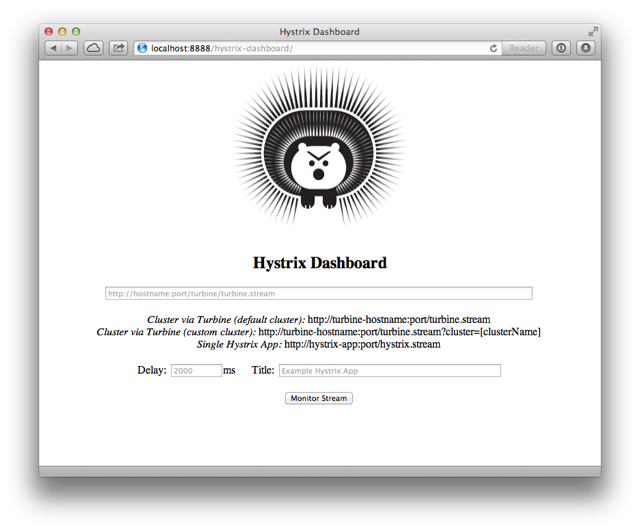
When you access the Hystrix Dashboard homepage you should see something like this:
To monitor a single server you would use a URL such as:
http://hostname:port/application/hystrix.stream
To monitor an aggregate stream via Turbine it would be like:
http://hostname:port/turbine/turbine.stream