Dashboard
The Hystrix Dashboard enables realtime monitoring of Hystrix metrics.
Use of this dashboard improved Netflix operations by reducing discovery and recovery times during operational events. The duration of most production incidents (already less frequent due to Hystrix) became far shorter, with diminished impact, due to the realtime insights into system behavior.
 (Click for larger view.)
When a circuit is failing then it changes colors (gradient from green through yellow, orange and red) such as this:
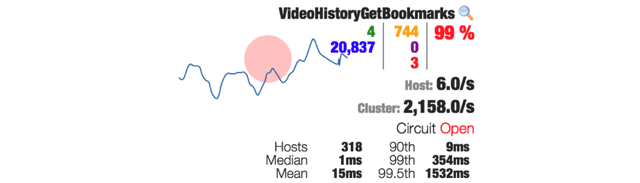
The diagram below shows one "circuit" from the dashboard along with explanations of what all of the data represents.
We've purposefully tried to pack a lot of information into the dashboard so that engineers can quickly consume and correlate data.

It allows monitoring a single server or cluster of servers in aggregate with low latency (typically around 1 or 2 seconds when aggregating a cluster, subsecond with a single server).

 (Click for larger view.)