The "Offer book" graph is showing inconsistent information #1525
Labels
Comments
|
@fedegrc Thanks for pointing this out. I'll have to see how this is calculcated atm and will come back to this issue soon. |
|
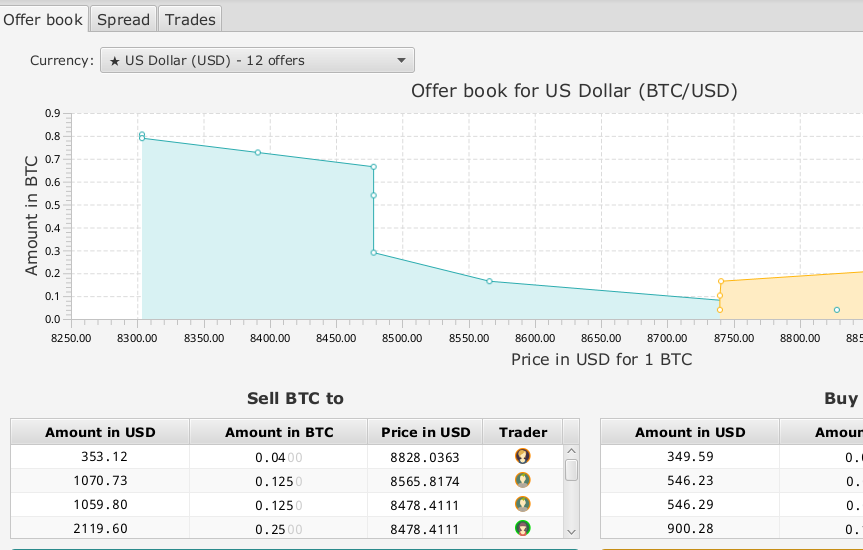
@ripcurlx , an easy way to see that the graph is wrong is recognizing that sometimes there is a vertical lines showing the same Price for two or more Amount in BTC, which is mathematically impossible (except if the vertical line is in the "first/best" value).
The Price col of the following table shows the correct values: |
|
This issue has been automatically marked as stale because it has not had recent activity. It will be closed if no further activity occurs. Thank you for your contributions. |
|
This issue has been automatically closed because of inactivity. Feel free to reopen it if you think it is still relevant. |
Sign up for free
to join this conversation on GitHub.
Already have an account?
Sign in to comment
Hi, I'm creating this issue in order to propose a change to the graph located in the section "Market -> Offer book". First, I'll describe the issue I'm seeing using this graph:
Following the table related to the Buy side of the previous graph:
The summation of all BTCs is 1.28 BTC. If we want to buy all BTCs, we should spend USD 12047.77, so the Price is 12047.77 / 1.28 = 9412.32. If we see the graph, it shows a Price of ~9760 instead of 9412.32
I have been working on a R function that could solve this issue and provide useful information. The result is this graph:
The text was updated successfully, but these errors were encountered: