Skip to content
New issue

Have a question about this project? Sign up for a free GitHub account to open an issue and contact its maintainers and the community.

By clicking “Sign up for GitHub”, you agree to our terms of service and privacy statement. We’ll occasionally send you account related emails.

Already on GitHub? Sign in to your account

关系日历图不能取到该图的最后一天,且会报错 #8045

Closed
wyy511 opened this issue Mar 28, 2018 · 0 comments
Closed

关系日历图不能取到该图的最后一天,且会报错 #8045

wyy511 opened this issue Mar 28, 2018 · 0 comments

Comments

@wyy511
Copy link

wyy511 commented Mar 28, 2018

One-line summary [问题简述]

中文简述:
最近在echarts官网上发现了一个问题,关系日历图的系列数据不能取到盖图表的最后一天,并且它的时间戳不是有正规的日历转换过来的话会有报错。按着常理来说不管用户写的数据正确与否,一般只是显示与不显示问题,而不应该报错。如果有人能解决这一问题,并且告诉我,我十分感谢!

English brief::
Recently discovered a problem in echarts official website, the relationship between calendar figure series data cannot take to cover the chart at the end of the day, and its time stamp is not have formal calendar conversion to come over there will be an error.According to common sense, whether the data written by the user is correct or not, it is generally only showing and not displaying the problem, and should not be reported wrong.If anyone can solve this problem and tell me, I am very grateful!

Version & Environment [版本及环境]

  • ECharts version [ECharts 版本]: 3.8.5和4.0.3都试过
  • Browser version [浏览器类型和版本]: 谷歌(goole)版本 65.0.3325.181(正式版本) (64 位)
  • OS Version [操作系统类型和版本]:64-bit operating system,x64-based processor

Expected behaviour [期望结果]

中文简述:
关系日历图能显示该表的最后一天,且无论用户输入的数据正确与否,都应该显示出图,而不应该报错

English brief:
The relationship calendar diagram shows the last day of the table, and whether the data entered by the user is correct or not, the diagram should be displayed, and should not be reported incorrectly.

ECharts option [ECharts配置项]

function getVirtulData(year) {
    year = year || '2017';
    var date = +echarts.number.parseDate(year + '-01-01');
    var end = +echarts.number.parseDate((+year + 1) + '-01-01');
    var dayTime = 3600 * 24 * 1000;
    var data = [];
    for (var time = date; time < end; time += dayTime) {
        data.push([
            echarts.format.formatTime('yyyy-MM-dd', time),
            Math.floor(Math.random() * 1000)
        ]);
    }
    console.log(data[data.length - 1]);
    return data;
}


var graphData = [
    [
        1485878400000,
        260
    ],
    [
        1486137600000,
        200
    ],
    [
        1486569600000,
        279
    ],
    [
        1486915200000,
        847
    ],
    [
        1487347200000,
        241
    ],
    [
        1487779200000,
        411
    ],
    [
        1488124800000,
        985
    ]
];

var links = graphData.map(function (item, idx) {
    return {
        source: idx,
        target: idx + 1
    };
});
links.pop();

option = {
    tooltip: {
        position: 'top'
    },

    visualMap: [{
        min: 0,
        max: 1000,
        calculable: true,
        seriesIndex: [2, 3, 4],
        orient: 'horizontal',
        left: '55%',
        bottom: 20
    }, {
        min: 0,
        max: 1000,
        inRange: {
            color: ['grey'],
            opacity: [0, 0.3]
        },
        controller: {
            inRange: {
                opacity: [0.3, 0.6]
            },
            outOfRange: {
                color: '#ccc'
            }
        },
        calculable: true,
        seriesIndex: [1],
        orient: 'horizontal',
        left: '10%',
        bottom: 20
    }],

    calendar: [
    {
        orient: 'vertical',
        yearLabel: {
            margin: 40
        },
        monthLabel: {
            nameMap: 'cn',
            margin: 20
        },
        dayLabel: {
            firstDay: 1,
            nameMap: 'cn'
        },
        cellSize: 40,
        range: '2017-02'
    },
    {
        orient: 'vertical',
        yearLabel: {
            margin: 40
        },
        monthLabel: {
            margin: 20
        },
        cellSize: 40,
        left: 460,
        range: '2017-01'
    },
    {
        orient: 'vertical',
        yearLabel: {
            margin: 40
        },
        monthLabel: {
            margin: 20
        },
        cellSize: 40,
        top: 350,
        range: '2017-03'
    },
    {
        orient: 'vertical',
        yearLabel: {
            margin: 40
        },
        dayLabel: {
            firstDay: 1,
            nameMap: ['周日', '周一', '周二', '周三', '周四', '周五', '周六']
        },
        monthLabel: {
            nameMap: 'cn',
            margin: 20
        },
        cellSize: 40,
        top: 350,
        left: 460,
        range: '2017-04'
    }],

    series: [{
        type: 'graph',
        edgeSymbol: ['none', 'arrow'],
        coordinateSystem: 'calendar',
        links: links,
        symbolSize: 10,
        calendarIndex: 0,
        data: graphData
    }, {
        type: 'heatmap',
        coordinateSystem: 'calendar',
        data: getVirtulData(2017)
    }, {
        type: 'effectScatter',
        coordinateSystem: 'calendar',
        calendarIndex: 1,
        symbolSize: function (val) {
            return val[1] / 40;
        },
        data: getVirtulData(2017)
    }, {
        type: 'scatter',
        coordinateSystem: 'calendar',
        calendarIndex: 2,
        symbolSize: function (val) {
            return val[1] / 60;
        },
        data: getVirtulData(2017)
    }, {
        type: 'heatmap',
        coordinateSystem: 'calendar',
        calendarIndex: 3,
        data: getVirtulData(2017)
    }]
};

Other comments [其他信息]

线上实例:http://echarts.baidu.com/examples/editor.html?c=calendar-charts
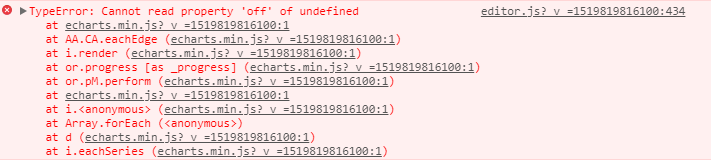
这个实例的第一个图,修改它的时间戳到该月的最后一天,会报错
image
image

@100pah 100pah closed this as completed in b18b505 Mar 29, 2018
Sign up for free to join this conversation on GitHub. Already have an account? Sign in to comment
Labels
None yet
Projects
None yet
Development

No branches or pull requests

1 participant