Behavior change between echarts 4.0.2 and 4.0.3: unselected data series now influences chart visuals #7831
Labels
Comments
Sign up for free
to join this conversation on GitHub.
Already have an account?
Sign in to comment
One-line summary [问题简述]
Unselected data series influence the way the charts look.
Version & Environment [版本及环境]
Expected behaviour [期望结果]
Unselected data series should not have an impact on the visuals (at least not after a minor version increase).
ECharts option [ECharts配置项]
Other comments [其他信息]
Screenshot of 4.0.2
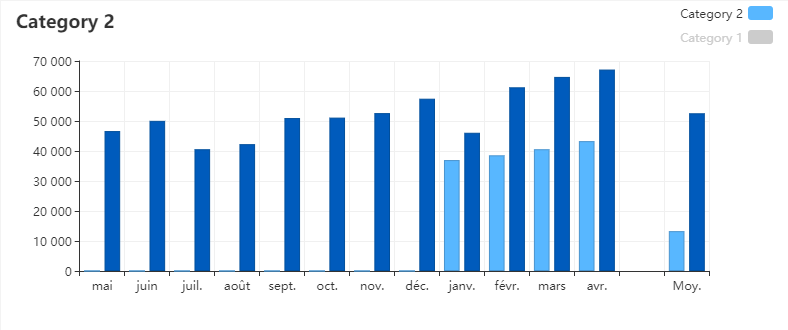
Screenshot of 4.0.3

The text was updated successfully, but these errors were encountered: