Heapster is depricated , but DashBoard still need Heapster , so we need to have both heapster and metric-server in our cluster for Dashboard and HPA
- We need additional permission to one of the subresouce
statsinnode; but the defaultsystem:heapsterrole don't have it.
So lets add that first
kubectl edit clusterroles system:heapster
Add below lines to the end and save the file
- apiGroups:
  - ""
  resources:
  - nodes/stats
  verbs:
  - get
- Create a directory to store manifests
mkdir dash-board
cd dash-board
- File lists
YAML_FILES="grafana.yaml
heapster.yaml
influxdb.yaml"
- Download manifests
for FILE in ${YAML_FILES}
do
 wget https://raw.githubusercontent.com/kubernetes/heapster/master/deploy/kube-config/influxdb/${FILE}
done
cd ..
wget https://raw.githubusercontent.com/kubernetes/heapster/master/deploy/kube-config/rbac/heapster-rbac.yaml
- Edit heapster.yaml and replace --source=kubernetes:https://kubernetes.default with below
--source=kubernetes.summary_api:https://kubernetes.default?kubeletHttps=true&kubeletPort=10250&insecure=true
- Deploy heapster and its dependancies
kubectl create -f dash-board
kubectl create -f heapster-rbac.yaml
- Make sure Pods with STATUS Running and RESTARTS count 0 (or not incresing if you were troubleshooting issues)
kubectl get pods --namespace=kube-system
- Output
NAME                                   READY   STATUS    RESTARTS   AGE
coredns-699f8ddd77-5bszs               1/1     Running   0          6h30m
coredns-699f8ddd77-bz2jd               1/1     Running   0          6h30m
heapster-684777c4cb-x5tfs              1/1     Running   0          74s
metrics-server-76ff48d4cd-tcsbn        1/1     Running   0          36m
monitoring-grafana-56b668bccf-4rg9g    1/1     Running   0          75s
monitoring-influxdb-5c5bf4949d-q8hfw   1/1     Running   0          75s
- Verify monitoring-grafana monitoring-influxdb services
kubectl get services --namespace=kube-system monitoring-grafana monitoring-influxdb
- Output
NAME                  TYPE        CLUSTER-IP       EXTERNAL-IP   PORT(S)    AGE
monitoring-grafana    ClusterIP   172.168.63.17    <none>        80/TCP     63s
NAME                  TYPE        CLUSTER-IP       EXTERNAL-IP   PORT(S)    AGE
monitoring-influxdb   ClusterIP   172.168.178.68   <none>        8086/TCP   63s
- Verify cluster services endpoints
kubectl cluster-info
- Output
Kubernetes master is running at https://192.168.78.220:6443
Heapster is running at https://192.168.78.220:6443/api/v1/namespaces/kube-system/services/heapster/proxy
CoreDNS is running at https://192.168.78.220:6443/api/v1/namespaces/kube-system/services/kube-dns:dns/proxy
monitoring-grafana is running at https://192.168.78.220:6443/api/v1/namespaces/kube-system/services/monitoring-grafana/proxy
monitoring-influxdb is running at https://192.168.78.220:6443/api/v1/namespaces/kube-system/services/monitoring-influxdb/proxy
- Deploy DashBoard
kubectl create -f https://raw.githubusercontent.com/kubernetes/dashboard/master/src/deploy/recommended/kubernetes-dashboard.yaml
- Make sure dash-board Pod is running
kubectl get pods --selector=k8s-app=kubernetes-dashboard -n kube-system
- Output
NAME                                    READY   STATUS    RESTARTS   AGE
kubernetes-dashboard-77fd78f978-cwpwr   1/1     Running   0          5m5s
- Create a DashBoard user with all privileges
kubectl create serviceaccount cluster-admin-dashboard-sa
kubectl create clusterrolebinding cluster-admin-dashboard-sa \
  --clusterrole=cluster-admin \
  --serviceaccount=default:cluster-admin-dashboard-sa
- Get the token to login
kubectl describe secret $(kubectl get secret | grep cluster-admin-dashboard-sa|awk '{print $1}') |awk '/token/{print $2}'
- Use the token to login to DashBoard
- To Access Dashboard via Browser
kubectl proxy
- Open an SSH tunnel ( 8001:127.0.0.1:8001 ) from local system (You can use Putty as well for tunneling)
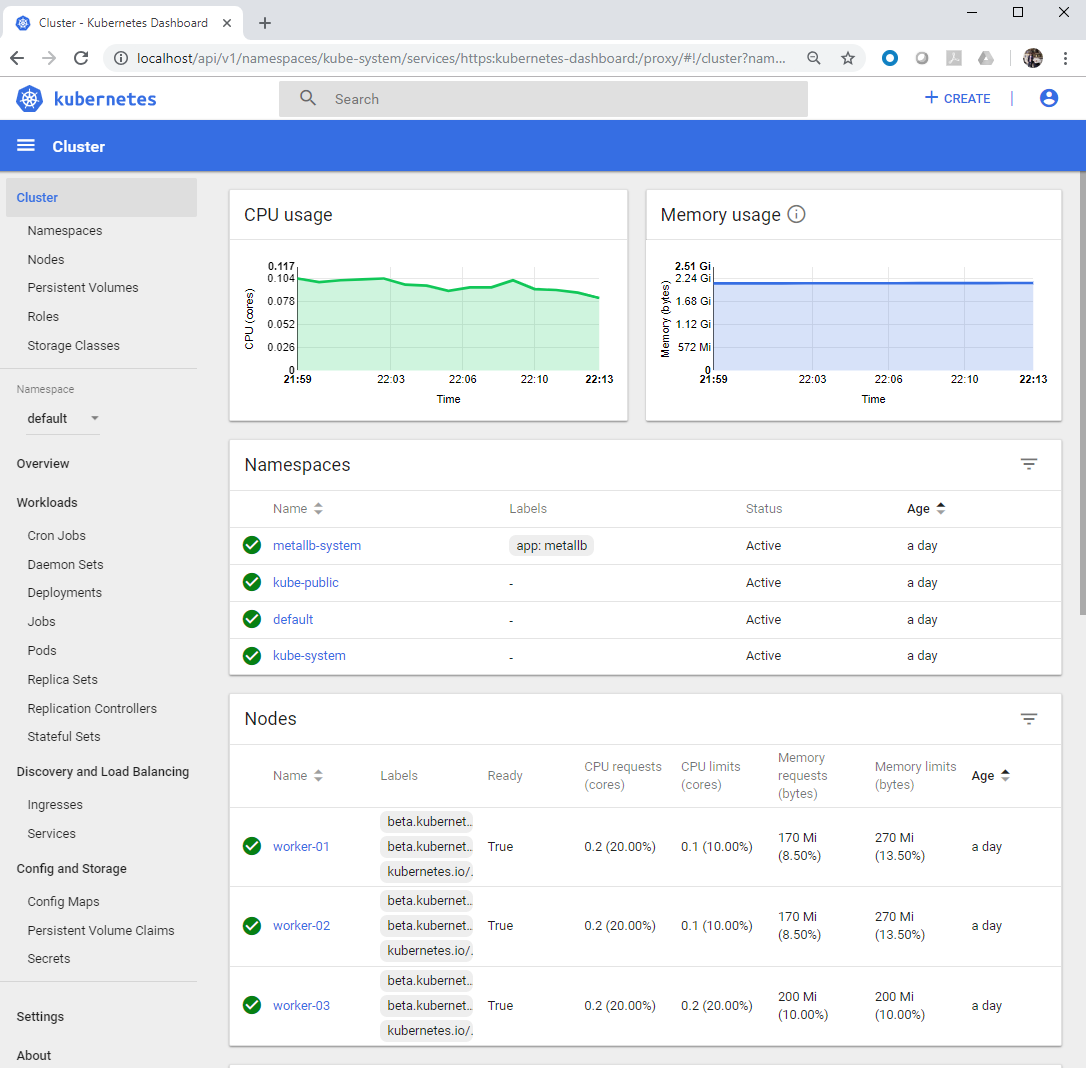
- Access Dashboard using URL
http://localhost:8001/api/v1/namespaces/kube-system/services/https:kubernetes-dashboard:/proxy
- We already have token from previous steps ; use that for login
Part 17 - Dynamic iSCSI Volume Provisioniner