GDB C/C++ debugger won't start, giving error #64948
Comments
|
It works good with previous version, but I got a same error after updating the code. OS : Ubuntu 14.04.5 x64
|

|
It works fine with 1.29.1 . (I've downgrade to 1.29.1) url : https://code.visualstudio.com/updates/v1_29
|
|
So this seems to be an issue in 1.30.0 only? I’ve tried the latest insider version and the bug is still present. |
|
In version 1.29, I can debug normally. I ran into a problem in version 1.30. |
|
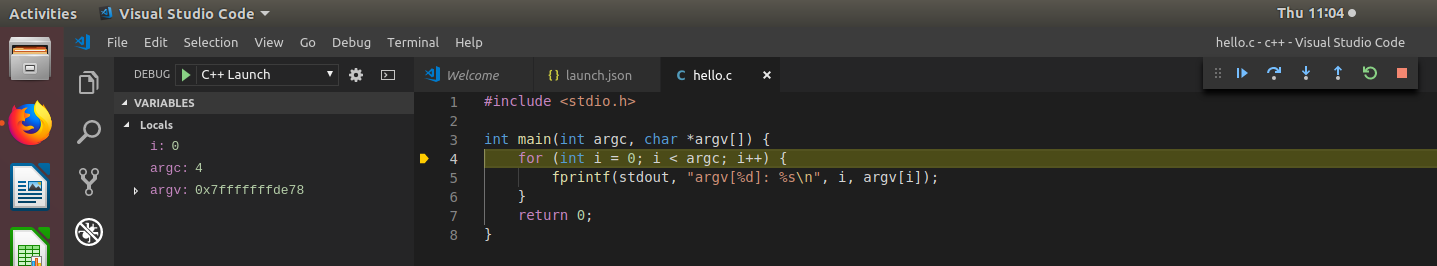
I have tried reproducing this and could not. I tried with Ubuntu 16 and Mac OS X. I believe this is an issue with the C++ extension thus I am moving it to the C++ repository. #include <stdio.h>
int main(int argc, char *argv[]) {
for (int i = 0; i < argc; i++) {
fprintf(stdout, "argv[%d]: %s\n", i, argv[i]);
}
return 0;
}{
"version": "0.2.0",
"configurations": [
{
"name": "C++ Launch",
"type": "cppdbg",
"request": "launch",
"program": "${workspaceRoot}/a.out",
"args": [
"hello", "world", "!"
],
"stopAtEntry": true,
"cwd": "${workspaceRoot}",
"linux": {
"MIMode": "gdb",
"miDebuggerPath": "/usr/bin/gdb"
},
"osx": {
"MIMode": "lldb"
},
"windows": {
"MIMode": "gdb",
"miDebuggerPath": "C:\\MinGw\\bin\\gdb.exe"
},
"externalConsole": false
}
]
}
|
|
Created issue in C++ extension repository. Follow the issue there for more details |
|
use "externalConsole": false to solve the issue in launch.json |
|
Yep, a crash deep inside the C++ debug adapter occurs if "externalConsole" is true. |
|
apt-get purge code and |
|
I was sending a RunInTerminalResponse without a body (which is a violation of the spec). I broke that 24 days ago but I wonder why nobody noticed this in Insiders. |
I was having the same issue and this solved the problem, plus is less annoying than opening a new terminal all the time you want to debug |
|
maybe you should add gcc option '-g' to compile before you debug it. and "externalConsole": false, |
Version: 1.30.0
Commit: c6e592b
Date: 2018-12-11T22:21:33.585Z
Electron: 2.0.12
Chrome: 61.0.3163.100
Node.js: 8.9.3
V8: 6.1.534.41
OS: Linux x64 4.18.0-3-amd64
Steps to Reproduce:
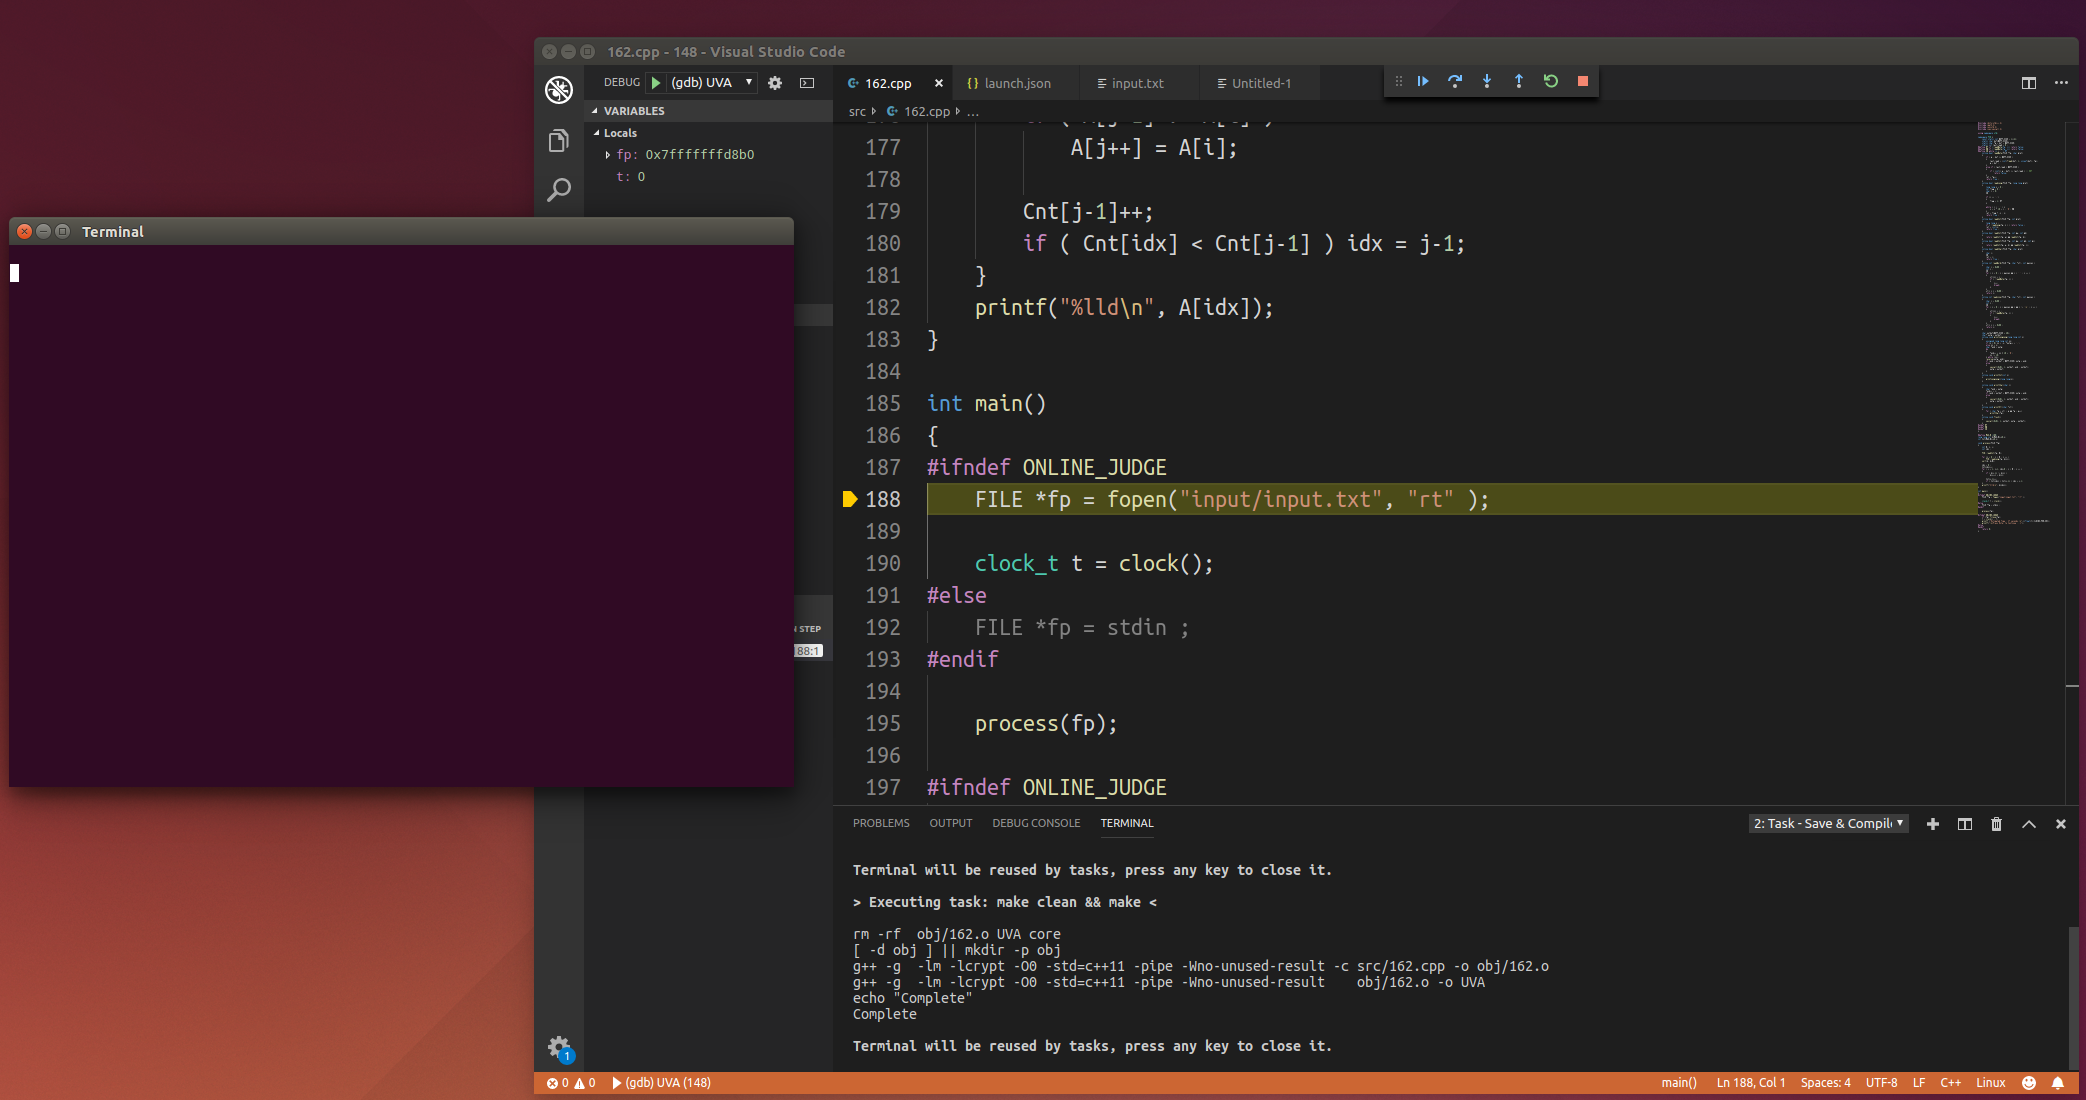
What happens:
The Debug Console displays:
The program does not start and the external console stays empty.
The C/C++ Extension must be enabled to use C/C++ debugging.
Screenshot:
The text was updated successfully, but these errors were encountered: