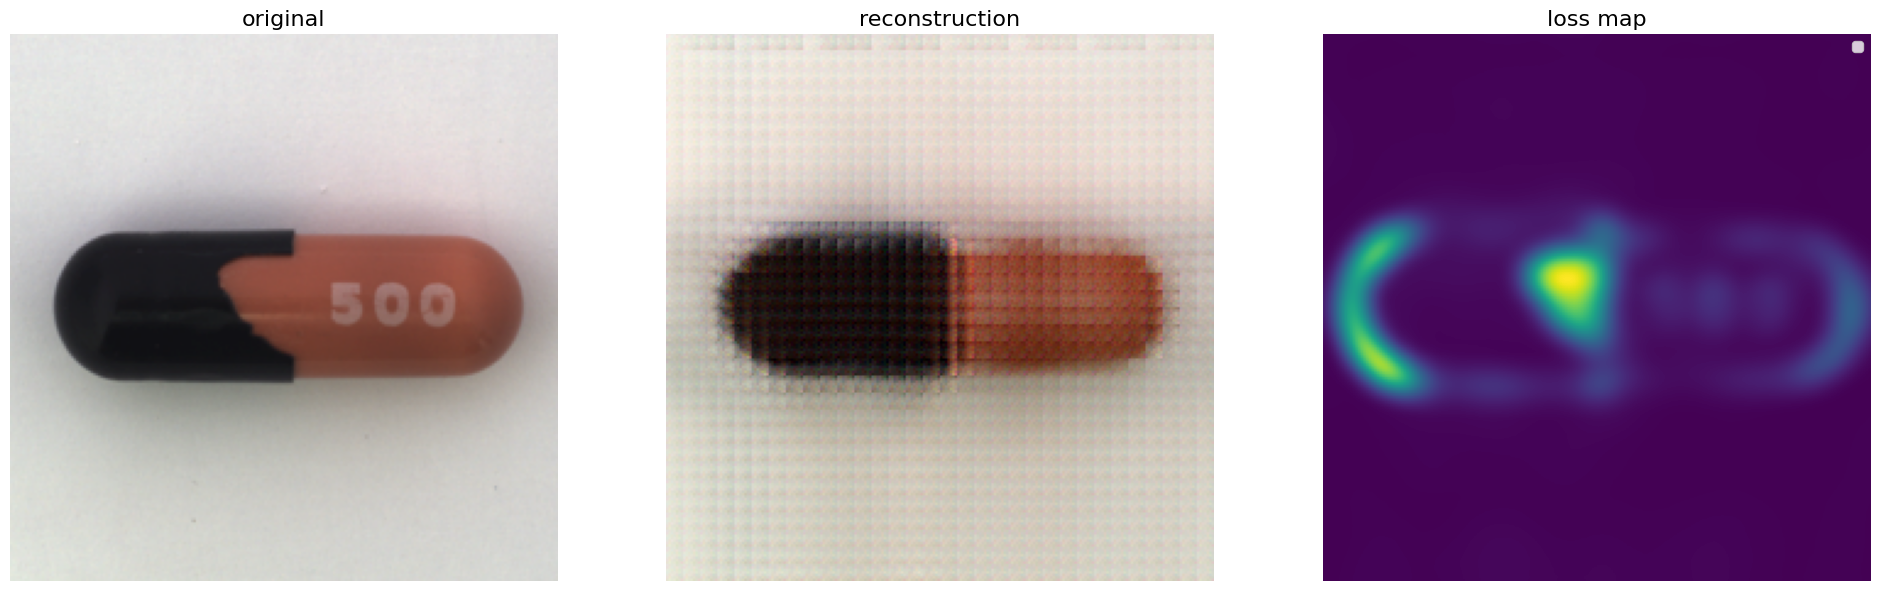
An idea I've had while thinking about the masked-autoencoder paradigm in self-supervised training. I train a modified Visual Transformer-based Masked Autoencoder on images of non-defective examples only, in self-supervised fashion. I then use the resulting model to reconstruct images of good and defective examples, and use the reconstruction loss as an anomaly score, thus producing an anomaly map for each example. The highest value of the scaled loss map constitutes the absolute anomaly score for the example, and it is flagged as defective if the score exceeds an adjustable threshold.


Denoising Diffusion Probabilistic Model trained on TinyImageNet and Google Images data; MLOps and hyperparameter sweep using WandB
I implement the "Denoising diffusion probabilistic models" paper (Ho et al.) from scratch and train it on a TinyImageNet class. Additionally, I scrape about 500 images from Google Images to roughly double the size of the training set. The hyperparmeters are optimised with WandB Sweeps to minimise the Frechet Inception Distance. Artifacts and runs are logged with WandB. Even with only 1,000 images and limited data augmentation, the model is able to learn and produce evocative pictures.


This web application generates lyrics in the style of various artists that I like (Radiohead, Bob Dylan, Arctic Monkeys, David Bowie, etc.). Give it the start of a sentence, and it will complete it. You can also play a game of "recognise the artist": A random prompt starts the lyrics generation, and you must guess whose style the model emulates. The LLMs are GPT-2 fine-tuned on each artist's complete collection of lyrics. The application is written in Javascript with CSS styling and a Python Flask backend.


![]()
![]()
![]()
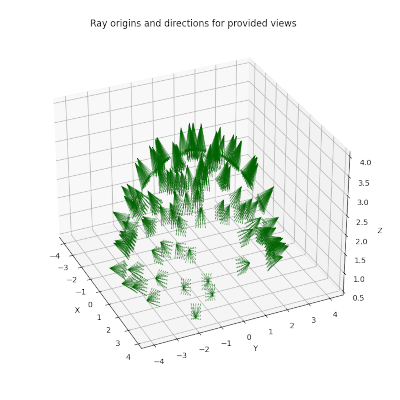
I implement a Neural Radiance Field model (Mildenhall et al.) in PyTorch from scratch. NeRF is a model able to generate novel views of a 3D scene after being trained on a collection of pictures of the scene from different angles. The model learns to predict the emitted colour and the density of each point in the scene from any angle, and accumulates these values along paths that reach each of the new view's pixels, resulting in a image.


These notebooks are part of a course that I designed and taught to second year CS BSc students at NewGiza University. I present a step by step worked example of how to sanitise data, explore it, visualise it, engineer new features, and fit and evaluate simple ML models.
The dataset contains eBay used car listings in the German market (found on Kaggle). It is fairly noisy, contains some ambiguous variables that could be considered as either continuous or categorical, and requires significant domain knowledge to fully exploit. As such, it is a good representation of the tasks a real Data Scientist might have to perform.


This notebook was originally developed to support a blog post (check out my Medium profile!). First, I explain what anomaly detection is. Then I give an intuitive explanation into variational autoencoders and why use them in anomaly detection (with animal analogies!).
Finally, I build a model and train it on a dataset to predict the failure of an industrial machine.


View the notebook on Google Colab
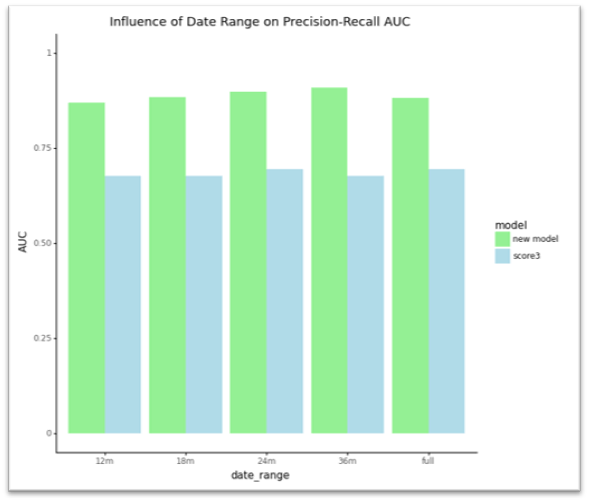
This presentation quickly summarises my approach to developing an account scoring system for one of our clients. For confidentiality reasons, I had to heavily redact it, but it will still give you an idea of the challenges and thoughtprocess to address them.
The model had to serve users from many different companies, each with different data nomenclatures. Therefore, I developed an automated ML (AutoML) pipeline that is able to perform model selection to train the best model for that company's data. The results were a substantial improvement over the previous model, with the user's estimated operating profitability improving by up to 5x.


For something a bit different, I use 2012 OECD data from the Programme for International Student Assessment (PISA) to analyse how different factors were predictive of math proficiency among 15-year-old students worldwide. After collecting and sanitising the data, I import it into Tableau, manipulate it, and create a 10-page story (i.e., a collection of dashboards). I look into factors such as: socio-economics, personal and family situation, cultural variables, personal and teacher's attitudes and methods, class frequency vs duration, familiarity with and frequency of the use of computers and information technologies.


Page template provided by evanca